
5 Ways to Use Bollinger Bands to Improve Your Trading Strategy
Enhance Your Technical Analysis with Bollinger Bands

Bollinger Bands are a powerful technical analysis tool that can help traders identify potential trading opportunities in the market. These bands consist of three lines that are plotted on a price chart: a simple moving average line, and two lines that are two standard deviations away from the moving average.
While Bollinger Bands are commonly used to identify overbought and oversold conditions, they can be used in a variety of ways to improve your trading strategy. In this article, we'll explore five ways you can use Bollinger Bands to gain an edge in the markets.
1. Identify Trends and Market Volatility
Bollinger Bands can help you identify trends and market volatility by visually representing the standard deviation of the price over time. When the bands are wide, it indicates high volatility, and when they are narrow, it indicates low volatility. By observing the width of the bands, you can determine whether the market is trending or ranging.
2. Spot Potential Breakouts
Bollinger Bands can also be used to identify potential breakouts. When the price moves beyond the upper or lower band, it is considered a potential breakout. Traders often use this signal to enter or exit trades, depending on whether they anticipate a continuation or reversal of the trend.
3. Use Bollinger Bands in Conjunction with Other Indicators
Bollinger Bands work well in combination with other technical indicators. For example, traders often use Bollinger Bands in conjunction with the Relative Strength Index (RSI) to confirm trend strength or weakness. By combining indicators, traders can gain a more comprehensive understanding of market conditions.
4. Monitor Support and Resistance Levels
Bollinger Bands can also help traders identify support and resistance levels. When the price approaches the upper or lower band, it is often a sign that the market is reaching a support or resistance level. Traders can use this signal to adjust their trading strategy accordingly.
5. Use Bollinger Bands for Risk Management
Finally, Bollinger Bands can be used for risk management purposes. By setting stop loss orders at the upper or lower band, traders can limit their potential losses in case the market moves against them. This approach can help traders manage risk and preserve capital.
While Bollinger Bands can be a powerful tool in your trading arsenal, it's important to note that they are not foolproof. Like any other technical analysis tool, Bollinger Bands can produce false signals, and they should always be used in conjunction with other indicators and analysis methods.
Additionally, it's important to have a solid understanding of risk management and money management when using Bollinger Bands. While they can help you identify potential trading opportunities, they can also lead to losses if not used properly.
One way to mitigate risk is to use a stop loss order at the upper or lower band, as mentioned earlier. Another way to manage risk is to use a position sizing strategy that takes into account your risk tolerance and the volatility of the market.
It's also important to keep in mind that Bollinger Bands are not a crystal ball. They cannot predict future market movements with 100% accuracy, and they should not be relied upon as the sole basis for making trading decisions. Always do your own research and analysis, and use Bollinger Bands as one tool among many.
In conclusion, Bollinger Bands can be a valuable tool for traders of all skill levels. By understanding how to use them to identify trends, spot potential breakouts, monitor support and resistance levels, and manage risk, you can improve your trading strategy and increase your chances of success in the markets. However, it's important to remember that no tool or strategy can guarantee profits, and that trading always carries a certain degree of risk.
About the Creator
Keep reading
More stories from writers in Trader and other communities.
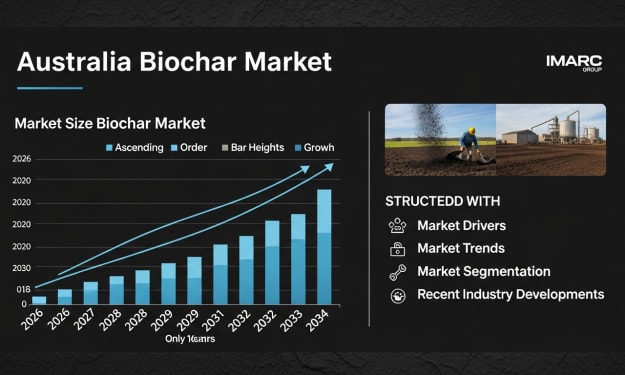
Australia Biochar Market Accelerates on Sustainable Agriculture, Carbon Sequestration and Circular Economy Commitments
The Australia Biochar Market is expanding rapidly as sustainable farming practices, climate action goals, and innovative waste conversion projects gain traction across the country. According to the latest IMARC Group research, the market reached USD 68.1 million in 2025 and is expected to grow to USD 169.3 million by 2034, registering a compound annual growth rate (CAGR) of 10.64% between 2026 and 2034.
By Rashi Sharmaabout 21 hours ago in Trader
Thoughts on Vocal and the way the world is
"Death cannot stop true love, only delay it." – Wesley in The Princess Bride. I decided to come back to Vocal on a very cold and dark night at the end of December. I had been, and still am, convalescing from a horrible staph infection that had gone misdiagnosed for months. This, paired with the increasing challenges of being healthy, making the best choices for my co-parented child, being a wife, and being a director at a new job, was a lot to manage.
By Jazzy 3 days ago in Confessions


Comments
There are no comments for this story
Be the first to respond and start the conversation.