
Why is Power BI the Best Business Intelligence Tool in 2025?
This blog is for anyone starting or looking to start their journey in the BI space


When I first started working in the BI spaces back in 2015, I was primarily working on SSIS, SSAS and SSRS. Gradually, I began transitioning to Power BI, which was emerging as a new BI tool and I was eager to explore new technologies. Since then, it has been an unforgettable journey of learning and growth.
I have now become a passionate BI enthusiast, with keen interest on everything related to data. It has been a journey filled with satisfaction, during which I have worked with various BI tools such as Tableau, DOMO, SAP BO and others. Yet, I believe that Power BI stands out as the best among them all.
In this blog, I list 6 reasons why Power BI takes the top spot!
1. Easy for Beginners
Firstly, Microsoft designed Power BI with an aim of making it easy for Excel users (and there are many) to transition easily to this new tool. And that's why, Power BI shared many similarities with Excel, specially in its initial years, and many of those still exist today. With its low-code/no-code analytics environment, Power BI is highly accessible to many individuals.
When I started, I relied heavily on "Guy in a Cube" Youtube videos, which were really helpful resources.
Secondly, Power BI offers one of the most user-friendly interfaces. While it takes time for starters to get familiar with any BI tool, In my opinion Power BI interface is the simplest with proper segregation and well organized panes, tabs, icons and bars. There is an ease and clarity in navigation form on view to another.
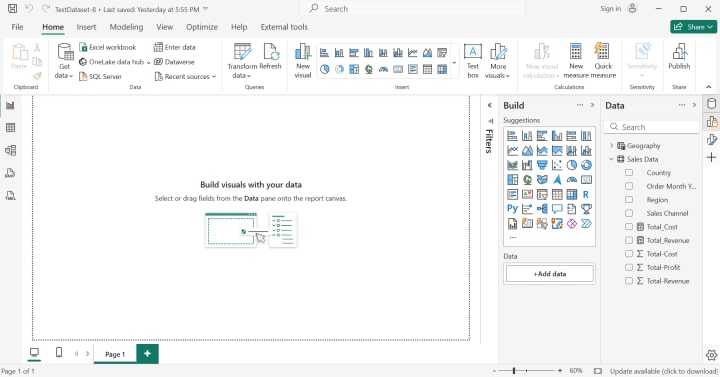
2. Data Visualization Capabilities
Data is the heart for any BI tool and it has to be presented in a manner that makes sense and brings out valuable insights.
With a wide range of visuals readily available in the Visualization pane, Power BI is miles ahead in this area. If your needs are required to use charts/visuals beyond the default list, then you can access the MS AppSource marketplace where there is no shortage.
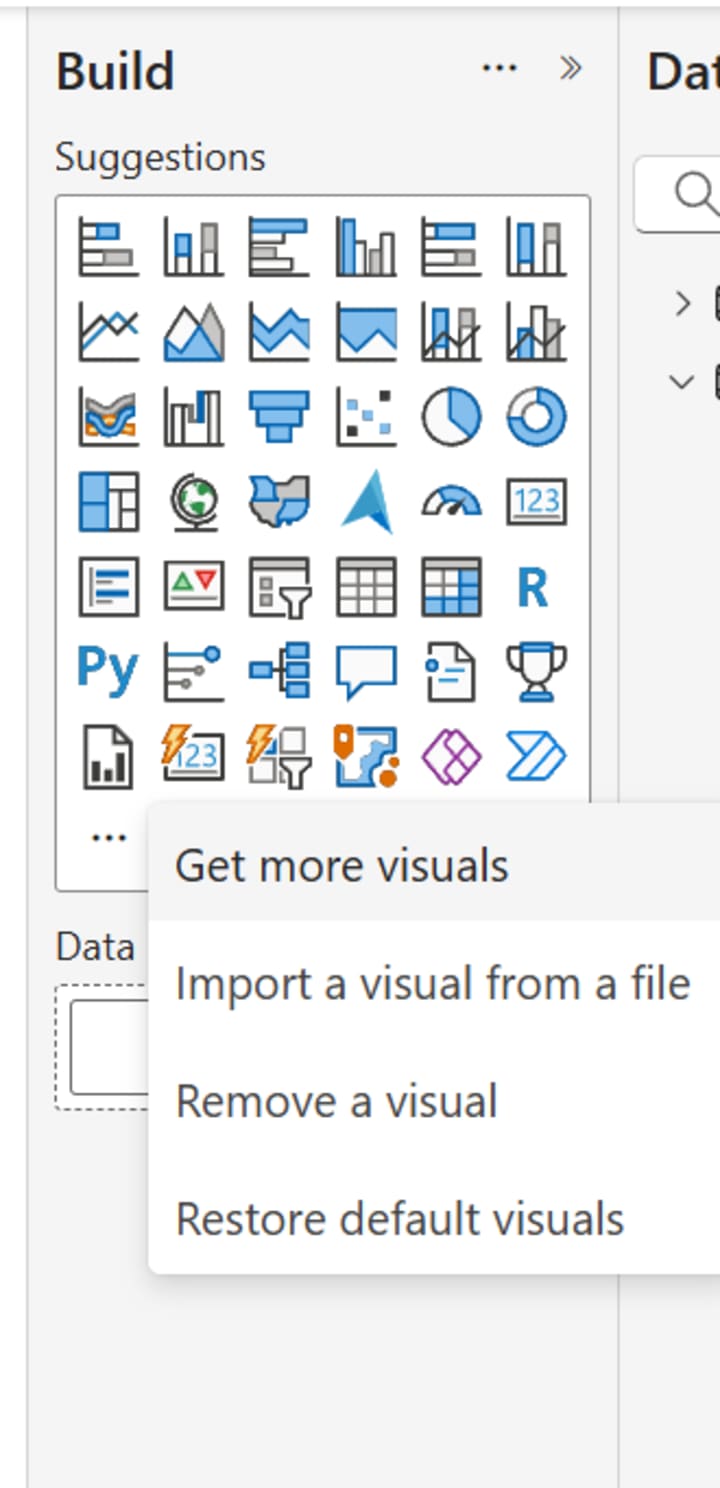
And if you're a tech geek and require to use customized visuals, you create your own .pbiviz visual file and import it for use.
3. Unmatched List of Data Sources/Connectors
This is the key USP of Power BI, there is an extensive list of data sources that can be connected. From flat files, excel and web data to large databases, cloud sources and big data etc., everything can be connected from Power BI. Not only the list of data sources supported is impressive but also the ease with which they can be connected is also real deal.
Power BI: Data source option Moreover, with different data connectivity and storage modes (Import, Direct Query, Live and Composite) you have the flexibility to choose, depending upon the type of data you want to load. This further enables you make your dashboard work at an optimal performance.
4. Sharing Capabilities
Reports and dashboards created with Power BI can be easily shared with the team members and clients.
Depending upon the license type (Free, Pro, Premium and Fabric capacity) there are different methods to share. You can export reports to Excel/Pdf and share static report as free users. If you want to share the interactive version, then you can make use of Power BI cloud service, where you can publish your report in Workspace and Apps and provide end users with access.
Additionally, you can also embed the reports into client web applications using the embedding license.
5. Cost Effectiveness
Power BI is one of the most cost-effective BI tools, considering the license-cost to output ratio. With various license options available, you can choose the one that best fits your requirement and organization size.
Power BI offers licenses for individual users as Pro license ($10) or Premium per user ($20) based. If the organization is small and only few developers, then these options would be the most cost-effective.
Larger organizations can go for capacity based license thus having the flexibility to decide on the pro licenses based on the number of developers you have while only viewing licenses for those who just need to access the reports.
You can read more on Power BI/Fabric pricing here 👉https://www.microsoft.com/en-us/power-platform/products/power-bi/pricing
This level of flexibility in licensing is not commonly found in other BI tools available in the market.
6. AI Integration
With Microsoft gradually integrating AI capabilities with Copilot in Power Bi, the self-service BI space is ready to take a new direction.
While NLP (Natural Language Processing) has always been part of Power BI, Copilot takes it further by allowing you to just ask for the visuals and insights you're looking for and it does the rest. Even DAX calculations (often the most complex part of Power BI) can now be generated in seconds. And that's just the beginning, there is much more to come with further advancement.
To know about Copilot integration in detail, you can refer the Microsoft video below👇
Conclusion
The BI space is continuously evolving and Power BI keeps pace by releasing updates every month, so that you are never behind on the latest techs/features. On top of this, the MS Fabric community and Power BI forums, offer invaluable resources and support, with hundreds of MVPs and Pro users offering their opinion and valuable insights to developers.
With all this, I believe Power BI is undoubtedly ahead of other BI tools in the market, especially has an edge for those who are beginners or want to break into field.
Thank you for reading till the end!
If you enjoyed this article, please consider giving it a like and leaving a comment. Your feedback motivates to write more!
*****
If you find my blogs valuable and want to support then you can Buy Me A Coffee.
- Subscribe me to read more from me Power BI, Data Analysis, Dashboarding and more.
*****
Note: This blog was originally published on Medium.
About the Creator
Akshay Mishra
Professionally, I'm a BI & Data Analytics Architect with 10 years of exp & I love sharing my expertise in Microsoft Power BI, Data Visualization, SQL & more.
Beyond the work, I like to read & write on World Politics, History & Geography.
Reader insights
Nice work
Very well written. Keep up the good work!
Top insights
Expert insights and opinions
Arguments were carefully researched and presented
On-point and relevant
Writing reflected the title & theme
Keep reading
More stories from Akshay Mishra and writers in Journal and other communities.
The Wheat Paradox
Wheat is one of humanity’s oldest cultivated crops and remains a cornerstone of the global food system. From bread and pasta to flatbreads and noodles, it provides nearly 20 percent of the world’s daily calories. Yet despite record levels of production in many years and advanced agricultural technologies, wheat has become a symbol of contradiction in the modern world. This contradiction — often referred to as the “wheat paradox” — lies in the fact that while global wheat supplies are broadly sufficient, access to affordable wheat-based food is becoming more fragile for millions of people.
By Salaar Jamali4 days ago in Journal


Comments
There are no comments for this story
Be the first to respond and start the conversation.