
Starbucks Can Actually Double It's Business Using Machine Learning, Here Is How!
And if Starbucks can make use of this, so can you, my friend

Project Overview
Business success is constantly Driven by Customer Satisfaction and the right insight into what customers think can be provided by the right kind of data analysis, the phrase 360-degree customer view means aggregating the data describing customer service interaction and customer’s purchase.
The Starbucks Udacity Data Scientist Nanodegree challenge dataset happens to be the simulation of the behavior of customers on Starbucks rewards mobile application. Starbucks sends its users advertisement, discount or even something like buy one get one free ( referred as BOGO) as offers. The important point to note here is that not all users of Starbucks receive the same offer.
The dataset provided in this challenge contains three different files. The first one is about the characteristics of the offers, such as the duration and the amount a customer needs to complete it(difficulty), the second file is about the demographic data such as age, gender, income when the customers created the account on their mobile application, the third file is about customer purchase and when the customers, viewed, received and completed their offer, the offer is only considered successful when a customer both views an offer and meets or exceeds its difficulty
Problem Statement (Metrics)
The problem here is to predict if the customer is gonna go for an offer or not. The step taken to solve the problem is four-fold. In the first step offer portfolio, customer profile, and transaction data is combined into a single dataset, each row of this will then describe an offer’s attributes, customer demographic data, and whether the offer was successful or not. The second step is to assess the accuracy as well as the F1-score of a naive model that presumes all offers were successful, which is used as a benchmark for all further models then built. Accuracy measures how well the model predicted whether the offer was successful or not, now if the percentage of successful or unsuccessful offers is very low, accuracy is not a good measure of model performance. In this situation, evaluating a model’s precision and recall will provide better insight into the models’ performance, here the F1-score metric is chosen because it is a weighted average of precision and recall metrics. The third step is to compare the performance of the logistic regression model, random forest model, and gradient boosting model. The fourth step is to optimize the parameters of the model that has the highest accuracy and F1-score.
Data Exploration And Visualization
The main objective of exploration and visualization in this project is to identify the preprocessing steps needed before combing the data files.
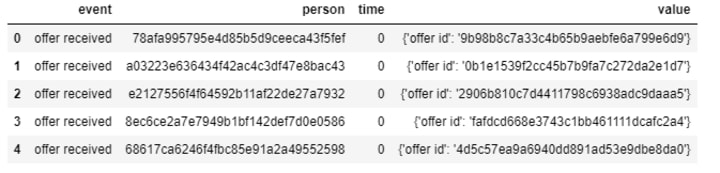
Customer Transaction Data
The data describes customer purchases and when they were received, viewed, and completed the offer. Two conclusions were drawn from the analysis of the data, it was noticed that it was required to separate customer, offer and purchase data and approx 45% of the events are customer purchases and 55% of events describe customer offers.
The algorithm implemented to clean customer transaction data has a total of six steps. First, name of the person column is changed to customers. Second Customer’s not in the customer profile dataframe is removed. Third time variables units are changed from hours to days. Fourth the name of time column is changed to timedays. Fifth a dataframe is created describing customer offers, along with offerid column and one hot encoding customer offer event types. Sixth a dataframe that describes customer transaction events.
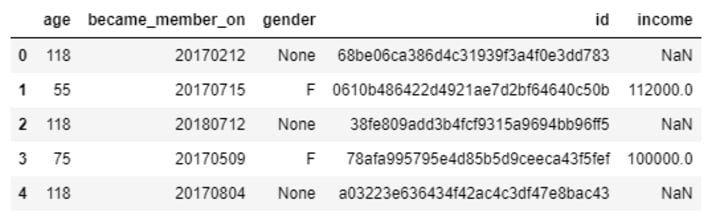
Customer Profile Data
Customer Profile Data has information about customer demographics. Five prime characteristics of this data observed during data analysis are, first, gender and income both have about 13% information missing, second, when customer income is missing, customer age is 118, customer gender has approximately 1.5% data missing, fourth, the year the customer signed up as rewards member is not uniformly distributed, thus this may be a useful customer differentiator, fifth the month a customer became a rewards member is approximately uniform, thus this feature is not very useful for predicting whether customer offer was successful.
Algorithm Implemented to clean customer profile data has seven steps. First customers with missing income data are removed. Second, Customer data where gender information is missing is removed. Third, the id column is renamed to customerid.frouth,became_member_on column is transformed to a DateTime object. Fifth customer’s membership start year is one-hot encoded, sixth customers age range is also one-hot encoded. Seventh customer’s profile’s gender attribute is transformed from a character to a number.
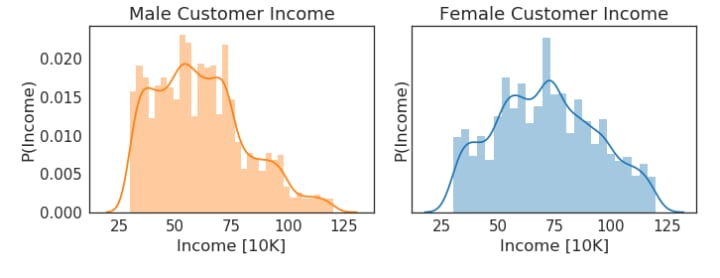
A total of three plots are generated to explore customer demographics. First, the distribution of customer income is plotted. These plots suggest the min and max of both the gender’s income are approximately the same, but males customer’s income is slightly biased towards lower values in comparison to the other gender’s income.
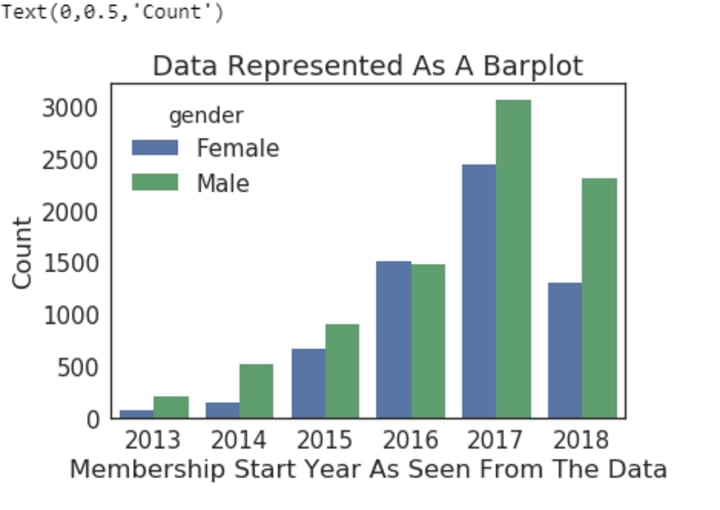
Next start year ‘s distribution is visualized, this suggests that most customers recently joined the program, this also suggests that there are more men than women.
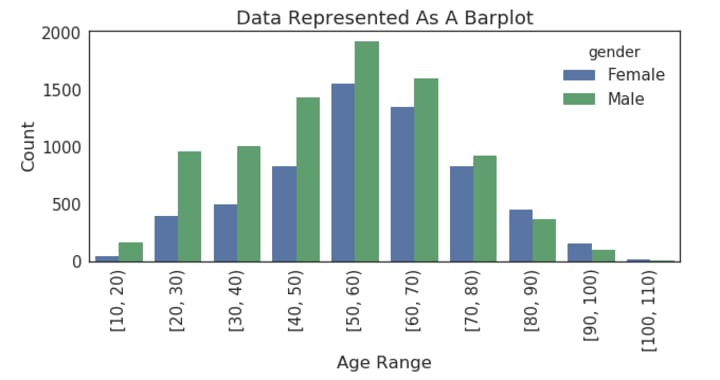
The next customer age range’s distribution is plotted, according to which the average age of customers is between 50 to 60.
Offer Portfolio Data
offer portfolio data describes customer offers, three concussions were derived by means of data analysis. First, the multi-label channels variable needs to be split using scikit-learn multilablebinarizer, Second id variable is renamed to offerid in order to distinguish it from customer identifiers. Third offer_type variable is one-hot encoded.
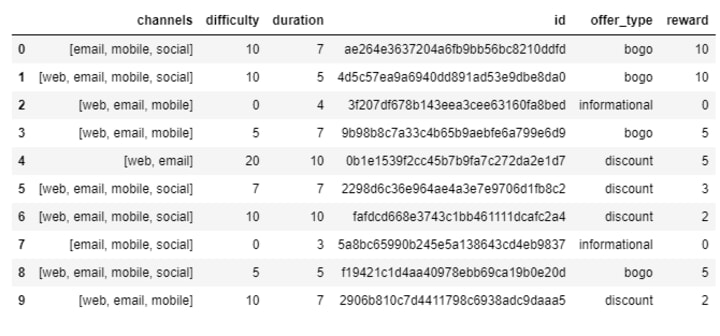
The algorithm that is implemented to clean the offer portfolio data has a total of six steps. First, id column is renamed to offerid. second duration column is renamed to durationdays. Third, underscores are removed from column names. Fourth, offertype column is one-hot encoded. Fifth, channels column is also one-hot encoded. Sixth offertype and channels columns with their respective one hot encoded values.
Combine Customer Transaction, Demographic and offer data
Data Cleaning is a process of applying a set of transformations to the dataset prior to making a predictive model. The algorithm used has five steps to it. First, one of the customer's profiles is selected. Second, offer data for a specific customer is selected. Third, transactions for a specific customer is selected. Fourth, Dataframes which describes when a customer receives, views and completes an offer is initialized. Fifth, the following procedure for each offer that a customer receives is applied
i)The current offer id is initialized
ii)The current offers description is looked-up
iii)The time period when the offer is valid is initialized
iv)All customer transactions that fall within the valid offer time window is Initialized into a Boolean array.
v)A boolean array that would select a description of when a customer completes an offer is initialized.
vi)A boolean array that would select a description of when a customer views an offer is initialized.
vii)whether the current offer was successful or not is Determined
viii) All customer transactions which occurred within the current offer valid time window is selected.
ix)A dictionary that would describe the current customer offer is initialized.
x)The list of dictionaries which describes the effectivity of an offer to a particular customer is updated.
Once all customer transactions have been evaluated, the resulting list of dictionaries is converted into a Pandas Dataframe
Predicting Success Of Customer Offer
The problem here is to predict if the customer is gonna go for an offer or not. The step taken to solve the problem is four-fold. In the first step offer portfolio, customer profile, and transaction data is combined into a single dataset, each row of this will then describe an offer’s attributes, customer demographic data, and whether the offer was successful or not. The second step is to assess the accuracy as well as the F1-score of a naive model that presumes all offers were successful, which is used as a benchmark for all further models then built.
The analysis suggests that the naive model accuracy was 0.4688 and its F1-score was 0.6383. Training data customer offer statistics was also evaluated, these results suggested that the distribution of offers is approximately uniform.
A random search of logistic regression, random forest and gradient boosting models in order to select the model with the highest accuracy and F1-score on the training data. Results Suggest that the random forest model had the highest accuracy compared to the rest, the model is then refined by using a grid search in order to improve it.
Bias and variance are the two characteristics of any ML model. Bias is the inherent model assumptions regarding the decision boundary between different classes and Variance refers to a model’s sensitivity to changes in its inputs.
The logistic regression model creates a linear decision boundary to separate successful and unsuccessful offers. exploratory analysis of customer demographics of each offer suggests that the decision boundary will be non-linear. Thus an ensemble method such as random forest or even gradient boosting should perform better.
Random Forest, as well as Gradient Boosting Models, happens to be a combination of multiple decision trees. Random Forest Classifier randomly samples the training data while replacing to construct a set of decision trees that are combined using majority voting. In contrast to that, Gradient Boosting iteratively constructs a set of decision trees with the prime goal of reducing the number of misclassified training data samples from the previous iteration to better improve its performance. The consequence of these Model Construction Strategies is that the depth of decision trees generated during random forest model training is greater than gradient boosting weak learner depth to minimize model variance. Generally, gradient boosting performs better than a random forest classifier, but gradient boosting happens to overfit the training data and requires additional effort to tune. However, A random forest classifier is less prone to overfitting because it constructs decision trees from random training data samples.
Conclusion
The problem here is to predict if the customer is gonna go for an offer or not. The step taken to solve the problem is four-fold. In the first step offer portfolio, customer profile, and transaction data is combined into a single dataset, each row of this will then describe an offer’s attributes, customer demographic data, and whether the offer was successful or not. The second step is to assess the accuracy as well as the F1-score of a naive model that presumes all offers were successful, which is used as a benchmark for all further models then built.
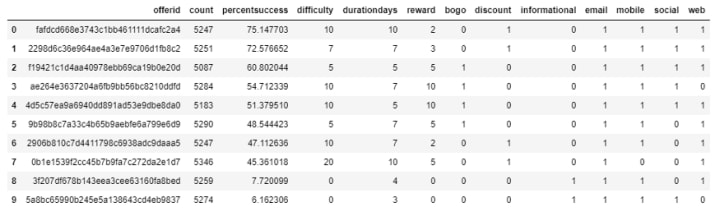
“Feature importance" is a numerical value that happens to describes a feature’s contribution to building a model that maximizes its evaluation metric. Random forest classifier is a model that takes into account feature importance during training. Analysis of Starbucks’s customer offer effectiveness training data suggests the top five features based on their importance are the following below:
1. Offer difficulty
2. Offer duration
3. Offer reward
4. Customer income
5. Whether a customer created an account on the Starbucks rewards mobile application in 2018
given that the top three features are associated with a customer offer, it perhaps may be possible to improve the performance of a random forest model, by creating new features that would describe the offer’s success rate as a function of offer difficulty, duration as well as reward. These additional features would give the random forest classifier an opportunity to construct a better decision boundary that separates successful and unsuccessful customer offers.
About the Creator
Keep reading
More stories from writers in Journal and other communities.
French Fury: The Jet Powered Mach 0.6 Interceptor That Could Reshape Air Defence
It seems that I’m writing stories about new drones and drone defences every week. Last week it was the Estonian Micromissile Mark 1. This week’s offering is a French drone capable of Mach 0.6 (700 kph/440 mph) with very high manoeuvrability.
By James Marineroabout 3 hours ago in Journal
Time to change your life.
Is it even possible for you to change your life? A lot of people, more than there should be, are unhappy with their lives. But what are they doing about it? Usually nothing. People talk about how shitty their lives are and want change, but are they not taking the actions to change?
By Jen Phillipsa day ago in Humans


Comments
There are no comments for this story
Be the first to respond and start the conversation.