
Non-repainting arrow indicator
Pine Script example for a non-repainting arrow indicator that works on candlestick patterns like Doji, Evening Star, and Hammer.

Here’s a basic Pine Script example for a non-repainting arrow indicator that works on candlestick patterns like Doji, Evening Star, and Hammer. This script identifies these patterns and places arrows on the chart for visual signals.
Non-Repainting Arrow Indicator in Pine Script
//@version=5
indicator("Non-Repainting Candlestick Pattern Indicator", overlay=true)
// Function to detect Doji
is_doji = abs(open - close) <= (high - low) * 0.1
// Function to detect Hammer (bullish reversal pattern)
is_hammer = (high - low) > 3 * (open - close) and (close - low) / (0.001 + high - low) > 0.6 and (open - low) / (0.001 + high - low) > 0.6
// Function to detect Evening Star (bearish reversal pattern)
is_evening_star = close[2] > open[2] and close[1] > close[2] and open[1] < close[1] and close < open and close < close[2]
// Plot arrows for each pattern
plotshape(is_doji, style=shape.triangleup, location=location.belowbar, color=color.blue, size=size.small, title="Doji")
plotshape(is_hammer, style=shape.triangleup, location=location.belowbar, color=color.green, size=size.small, title="Hammer")
plotshape(is_evening_star, style=shape.triangledown, location=location.abovebar, color=color.red, size=size.small, title="Evening Star")
Features of This Script:
Non-Repainting: The script uses only historical price data, ensuring it does not repaint after a new candle forms.
Candlestick Patterns:
Doji: Identified when the open and close prices are close together.
Hammer: A bullish reversal pattern detected based on candle wicks and body.
Evening Star: A bearish reversal pattern formed over three candles.

Visual Arrows:
Blue arrow below the bar for Doji.
Green arrow below the bar for Hammer.
Red arrow above the bar for Evening Star.
How to Use:
Copy the code into the Pine Script editor in TradingView.
Save and add the indicator to your chart.
Look for arrows on the chart indicating the patterns:
Buy Signal: Blue or green arrow.
Sell Signal: Red arrow.
Let me know if you need help customizing this script further!
How does it work Pine Script ?
Pine Script is a programming language used to create custom technical indicators, trading strategies, and alerts on TradingView charts. It’s designed to be simple and intuitive, enabling traders to create their tools directly within TradingView.
Here’s a breakdown of how Pine Script works:
1. Basic Structure of Pine Script
Pine Script programs follow a structured format, typically starting with the //@version directive, followed by indicator or strategy definitions.
Example Structure:
pinescript
Copy
Edit
//@version=5
indicator("My Indicator", overlay=true)
//@version=5: Specifies the version of Pine Script being used.
indicator(): Declares an indicator script (use strategy() for automated strategies).
"My Indicator": The name of the indicator.
overlay=true: Plots the indicator directly on the price chart. If false, it plots in a separate panel.
2. Core Elements
Variables
Variables store data or perform calculations. They can use values like price, time, volume, or results of formulas.
pinescript
Copy
Edit
price = close // Current candle's close price
average = ta.sma(close, 14) // 14-period Simple Moving Average
Built-in Functions and Libraries
Pine Script provides built-in functions for technical analysis:
ta.sma(close, 14): Calculates a simple moving average.
ta.rsi(close, 14): Computes the Relative Strength Index.
math.max(a, b): Returns the larger of two values.
Plotting
Visualize data on the chart using plot(), plotshape(), and other plotting functions:
pinescript
plot(close, color=color.blue, linewidth=2) // Plot close price as a line
plotshape(ta.crossover(close, average), style=shape.labelup, location=location.belowbar)
3. Logic and Conditions
If-Else Logic
Use logical conditions to define signals or criteria.
pinescript
Copy
Edit
is_above_ma = close > average
plotshape(is_above_ma, style=shape.triangleup, location=location.belowbar, color=color.green)
Bar-to-Bar Calculations
Use historical references with square brackets [n] to access past values:
pinescript
Copy
Edit
previous_close = close[1] // Close price of the previous bar
4. Non-Repainting
Non-repainting indicators avoid using future data (which doesn’t exist during live trading). Pine Script ensures non-repainting if:
Calculations are based only on historical data (e.g., close[1] or high[2]).
Avoid functions like security() improperly (e.g., lookahead=true can repaint).
Example of a non-repainting script:
pinescript
Copy
Edit
signal = close > ta.sma(close, 14)
plotshape(signal, style=shape.triangleup, location=location.belowbar, color=color.green)
5. Strategies and Alerts
Strategies
Pine Script allows defining strategies for backtesting and automation.
pinescript
Copy
Edit
//@version=5
strategy("My Strategy", overlay=true)
long_condition = ta.crossover(close, ta.sma(close, 14))
if (long_condition)
strategy.entry("Buy", strategy.long)
Alerts
Set alerts using alertcondition() for real-time notifications.
pinescript
Copy
Edit
alertcondition(long_condition, title="Buy Alert", message="Buy triggered!")
6. Using Pine Script in TradingView
Access the Editor:
Open TradingView and go to Pine Editor at the bottom of the screen.
Write Code:
Paste your code into the editor and click Add to Chart.
Customize Inputs:
Use input() to create adjustable settings for your indicator/strategy.
Example: A Simple Moving Average Crossover Strategy
pinescript
Copy
Edit
//@version=5
strategy("SMA Crossover", overlay=true)
// Define Moving Averages
fast_ma = ta.sma(close, 10)
slow_ma = ta.sma(close, 50)
// Plot MAs
plot(fast_ma, color=color.green, title="Fast MA")
plot(slow_ma, color=color.red, title="Slow MA")
// Entry and Exit Conditions
long_condition = ta.crossover(fast_ma, slow_ma)
short_condition = ta.crossunder(fast_ma, slow_ma)
if (long_condition)
strategy.entry("Buy", strategy.long)
if (short_condition)
strategy.close("Buy")
Summary
Pine Script simplifies the process of creating indicators and strategies for technical analysis. Its key features include:
Intuitive syntax.
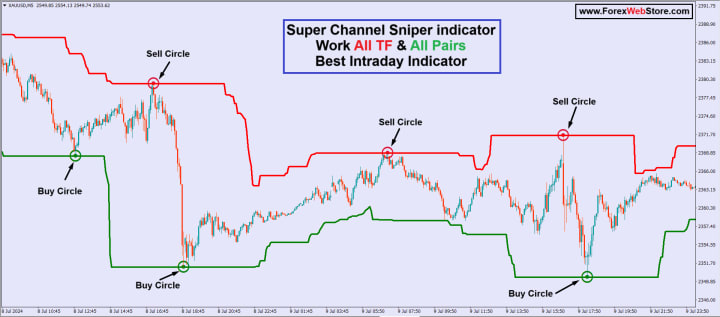
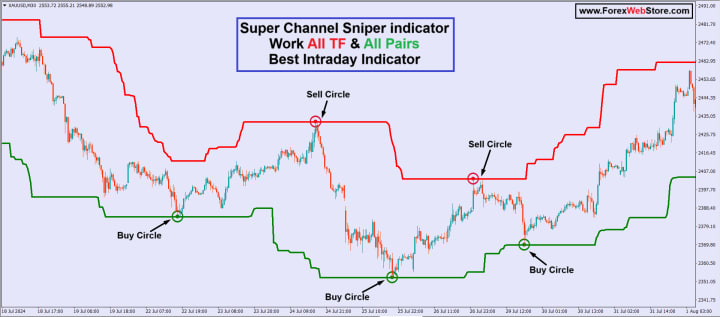
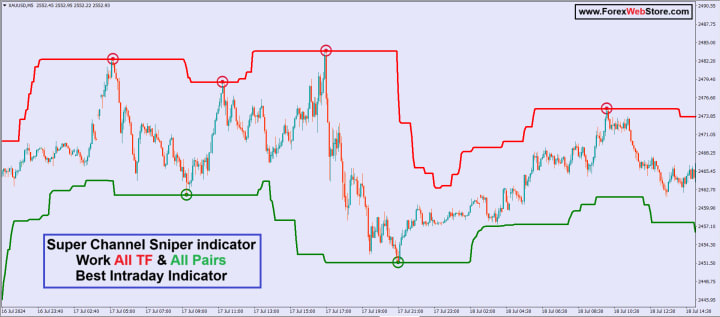
https://forexwebstore.com/product/super-channel-sniper-indicator/
Built-in functions for common calculations.
Tools for non-repainting logic.
Backtesting and alert functionality.
If you have a specific idea, I can help you implement it!
About the Creator
Pooja Verma
Forexwebstore.com Discover the Best Forex Indicators for a Simple Strateg. This page features key technical indicators for the most popular currency pairs in real time.
Keep reading
More stories from Pooja Verma and writers in Trader and other communities.
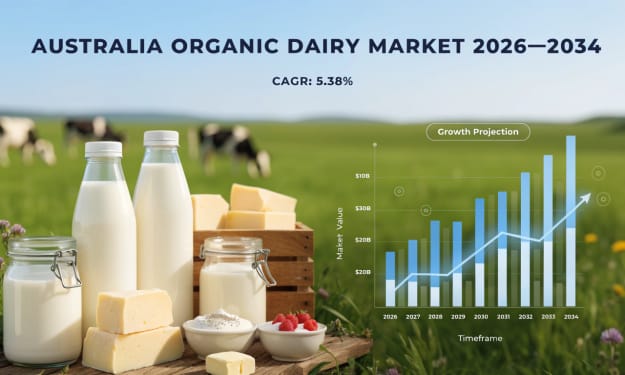
Australia Organic Dairy Market 2026: Clean-Label Demand, Health Consciousness & Sustainable Consumption
Australia Organic Dairy Market Overview The Australia organic dairy market is expanding steadily as consumers increasingly prioritise health, sustainability and transparency in food choices. Organic dairy products — including organic milk, yogurt, cheese, butter and cream — are produced from livestock raised without synthetic hormones, antibiotics or chemical fertilisers, appealing to environmentally conscious and health-oriented buyers. With improving retail availability, rising disposable incomes and growing preference for clean-label alternatives, the organic dairy segment is gaining traction across supermarkets, speciality stores and online channels.
By Amyra Singh4 days ago in Trader
S&P 500 Index Moves Upward: What This Strong Market Signal Could Mean for Investors
S&P 500 Index is once again gaining strong interest among investors. The recent upward movement in the S&P 500 Index has sparked fresh discussion across the market. Investors around the world are now watching the S&P 500 Index closely to understand what this trend may mean for future market direction. The S&P 500 Index tracks 500 large companies in the United States. These companies represent many sectors such as technology, healthcare, finance, and consumer goods. Because the S&P 500 Index includes many industries, it often shows the overall health of the stock market. Recently, the S&P 500 Index has shown steady growth. This movement has encouraged investors to study the index more carefully. Many believe the S&P 500 Index may provide signals about where the market could move next.
By John.doe798about 16 hours ago in Trader


Comments
There are no comments for this story
Be the first to respond and start the conversation.