
Irrational Exuberance and Future Returns: What the CAPE Ratio Is Telling Us Now
Irrational Exuberance and Future Returns

The phrase "irrational exuberance" was coined by Fed Chair Alan Greenspan in 1996 to describe market prices driven more by investor sentiment than fundamentals. Since then, it has become shorthand for manias and bubbles - famously analyzed by Robert Shiller in his book Irrational Exuberance, which highlights overvalued markets using tools like the CAPE ratio (Cyclically Adjusted P/E).
📊 P/E vs. CAPE: What's the Difference?
It's common to use the P/E ratio (Price-to-Earnings) to evaluate a company's valuation. You simply divide the price per share by the earnings per share. For example:
- If a stock trades at $100 and earns $5 per share, its P/E is 20.
This method usually uses trailing 12-month earnings (TTM) - but that can be misleading during economic booms or recessions.
To address this, Robert Shiller introduced the CAPE ratio, which compares the current price of the S&P 500 index to the average of the past 10 years of inflation-adjusted earnings per share. By smoothing out short-term volatility and correcting for inflation, CAPE gives a better sense of long-term valuation.
🔍 Historical Context
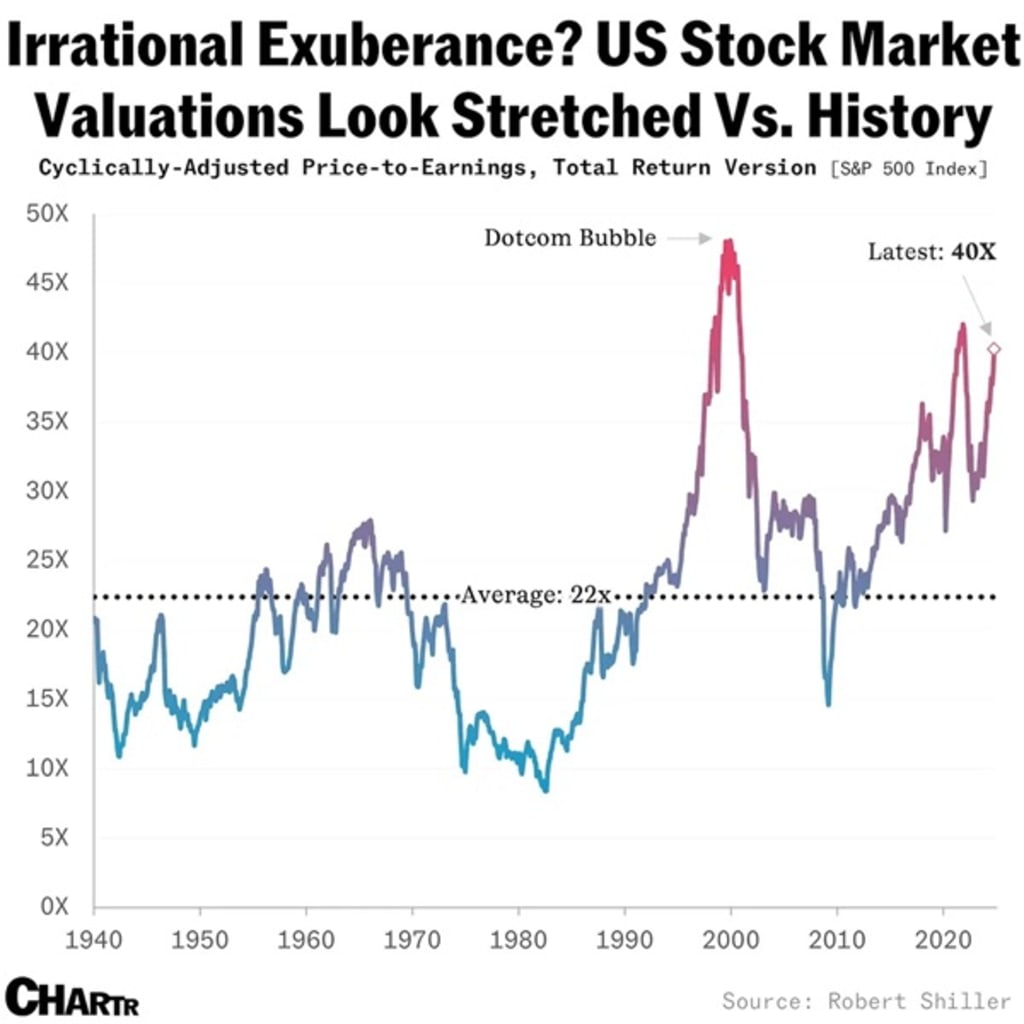
Historically, this ratio averaged in the range of 15–22; readings above ~30 are often labeled signs of exuberance. As of this writing (mid-2025), the CAPE ratio is around 37, significantly above the long-term average - ranking valuations among the highest ever.
🔹In 1929, the CAPE peaked at about 32. A market crash (the Great Depression) followed resulting in an 86% drawdown by mid-2032.
🔹 In 2000, the CAPE peaked at about 44. A 49% and a 78% decline in the S&P 500 and Nasdaq, respectively, followed (Dot-com Bubble).
🔹 In 2007, the CAPE peaked at about 37. A 57% decline in the S&P followed (Financial Crisis).
🔹 In 2021, the CAPE peaked around 39. A 25% downturn followed.
🔹 Today (mid 2025), the CAPE is around 37, eclipsed only by the dot-com bubble.
The graph (from Voronoi, based on Shiller data) shows the CAPE ratio spiking well above its historical blue‑line baseline since 2020, hitting levels only eclipsed by the dot-com era. It highlights a stretched valuation band, with the current reading (~37) sitting near its all‑time highs.
📉 What This Means for Future Returns
A high CAPE ratio does not signal an imminent market crash as markets can stay exuberant longer than expected. It does signal, however, low long term returns ahead. A CAPE ratio above 30 has historically led to just 0%–3% annualized real returns over the following decade, while a CAPE ratio in the 10–15 range often precedes 10%+ annualized returns. This is because long-term returns are primarily driven by corporate earnings growth. When share prices are irrationally high, future gains are effectively "pulled forward" in expectation of future earnings growth, leaving less upside.
🔮 What's Next for the Market?
So where will the market go from here? Here are the three possible scenarios in ascending order:
Muted single digit annual returns over the next decade. This is the least likely, as markets usually overshoot and undershoot taking a random-walk path to new highs.
A major crash (30% to 50% drawdown for the S&P), similar to the previous two crashes (the 2008 financial crisis and the covid crash). This is also unlikely as it takes a major event to cause such declines. For example, the great financial crisis was triggered by the failure of major financial institutions, millions of people losing their homes and worldwide contagion with countries like Greece getting bailed out, etc. Similarly, covid resulted in shutting down major economies, and crippling supply chains worldwide. As of this writing, no obvious systemic threats are visible. Rolling back the financial regulations that were put in place to avoid a repeat of the financial crisis of 2008 and easing crypto currency regulations does have the potential to lead to a new financial crisis, but will take years of spreading through the financial system before it can cause such a calamity. However, there is always the unexpected surprise such as the COVID pandemic.
We will continue to see markets overshoot then correct (decline by 10% to 20%). The sheer magnitude of overvaluation - as indicated by the CAPE ratio - suggests that corrections may need to occur more frequently and/or with greater severity. This is the most likely outcome. Erratic trade and economic policies, as well as erratic geopolitical and adverse domestic policies further support this outcome.
Regardless of which one of these three paths markets take we know one thing for sure, at these valuations, inflated market returns are unlikely to persist over the long term.
📌 Conclusion
Current readings show markets are priced well above long-term norms. Whether "irrational exuberance" unwinds slowly or abruptly is uncertain - but historically, such levels have led to muted returns or corrections. Keep an eye on valuation metrics and sentiment indicators - they're flashing caution lights.
It is important, however, to realize that high valuations do not indicate an immediate crash as markets can stay elevated for years. However, a high CAPE does indicate muted future returns when it comes to index investing. It is also important to keep in mind that rarely does anyone call a top accurately. Diversification & discipline beat timing. The highly overvalued shares that trade on momentum will (as always) be the ones that will get hit the hardest and may take years or decades to recover after a downturn, or may never recover at all. Trimming overvalued assets and rebalancing are key to wise investing. As Buffett said, the best time to be greedy is when others are fearful. When exuberance dominates, it's the prudent investor who prepares.
About the Creator
Keep reading
More stories from Maher Quraan, PhD and writers in Trader and other communities.
Best stocks for investment
📈 1. NVIDIA (NVDA) — AI and Data Center Domin Nvidia is arguably the most pivotal company in the ongoing AI revolution. Its GPUs and AI accelerators power data centers, generative AI workloads, and large language model training/inference — a secular trend expected to expand for many years. Analysts see continued strong earnings and revenues tied to AI infrastructure buildouts by hyperscalers. Its dominance has helped Nvidia deliver historically outsized returns but its core AI role suggests long-term structural growth ahead.
By USA daily update 4 days ago in Trader

Comments
There are no comments for this story
Be the first to respond and start the conversation.