
Easily Test and Verify Crypto Trading Strategies with Backtesting and Forward Testing
No coding required!


Before risking real money, it’s important to make sure your trading strategy works well and can deliver reliable results. That’s where backtesting and forward testing come into play.
In this article, we’ll dive into these essential testing methods, show you how to backtest a trading strategy, and break down the results step by step. The best part? You don’t need any coding skills to get started.
What Are Backtesting and Forward Testing?
We’ve all come across YouTubers and influencers boasting about trading strategies that supposedly generate massive returns—1000% or more in just a few months. But how can you be sure those claims are real? That’s where backtesting steps in. By testing a strategy against historical market data, backtesting allows you to objectively evaluate its performance. It cuts through the hype and gives you the tools to confirm whether a strategy genuinely works or is just another unproven claim.
However, even if a strategy performs exceptionally well in backtesting, that doesn’t guarantee success in live trading. Why? It might be overfitted—tailored to excel on past data but struggling to adapt to the complexities of live markets. This is where forward testing comes into play. Forward testing uses real-time market data to simulate how a strategy performs, but instead of risking real money, it uses virtual funds. This process helps traders observe their strategy in action, uncover potential issues, and fine-tune it for real-world success.
Let’s Backtest Our First Strategy — Free and No Coding Required
For the sake of simplicity in this article, we’ll backtest a straightforward trading strategy to demonstrate how backtesting works and what kind of insights you can gain from it. While we’re keeping things simple here, you can create your own advanced strategies, customize them across multiple timeframes, and backtest them to see how they perform.
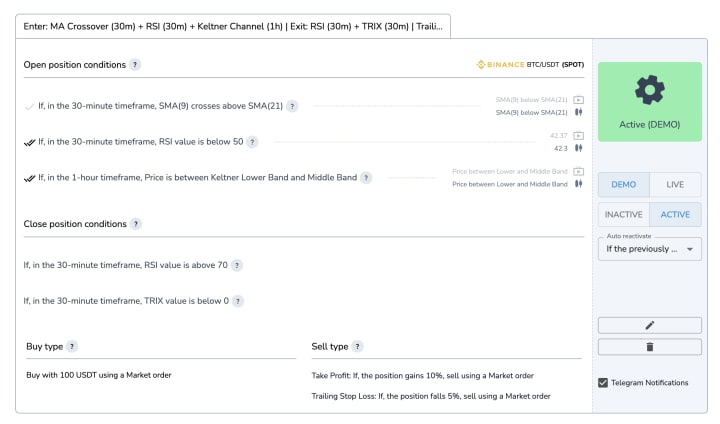
The strategy we’ll be working on uses AND logic for both buy and sell conditions. This means that all specified conditions for a buy or sell action must be met simultaneously for a trade to be executed. Here’s the strategy setup:
Buy Strategy (Using AND Logic)
- If, in the 30-minute timeframe, SMA(9) crosses above SMA(21).
- If, in the 30-minute timeframe, RSI value is below 50.
- If, in the 1-hour timeframe, the price is between the Keltner Lower Band and the Middle Band.
Sell Strategy (Using AND Logic)
- If, in the 30-minute timeframe, RSI value is above 70.
- If, in the 30-minute timeframe, TRIX value is below 0.
Risk Management
- Take Profit: +10%
- Trailing Stop Loss: -5%
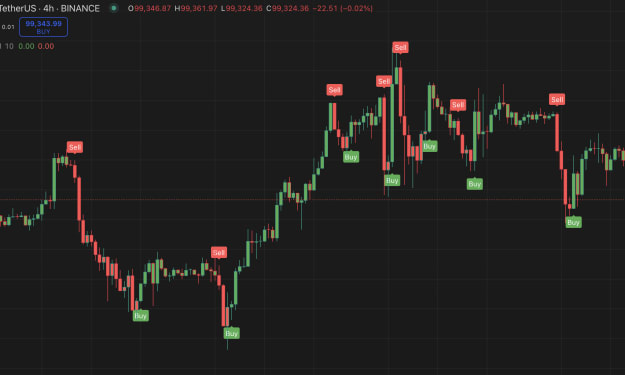
We’ll backtest this strategy on the BTC/USDT pair using historical data from the Binance exchange, covering the entire year of 2024 — from January 1st to December 31st, 2024. This timeframe ensures we analyze the strategy’s performance across different market conditions, providing valuable insights into its effectiveness. Let’s review how our strategy performed:
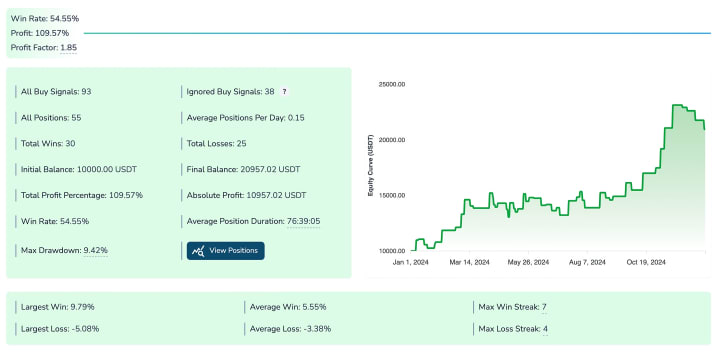
The backtesting results for the BTC/USDT strategy over 2024 indicate a total profit of 109.57%. The strategy achieved a win rate of 54.55%, with 30 successful trades out of 55 positions.
A key aspect of this strategy is its setting to allow only one open position per pair at any given time. This means new buy signals are ignored if an existing position is still active—either awaiting take profit or stop loss. As a result, 38 buy signals were skipped during the backtesting period because the previous position had not yet closed.
The strategy also maintained a profit factor of 1.85 and a maximum drawdown of 9.42%, highlighting a balanced approach to risk and reward. The largest win was 9.79%, while the largest loss was -5.08%, aligning perfectly with the defined risk management rules of +10% take profit and -5% stop loss.
Overall, the strategy delivered encouraging results, with a steady equity curve that showcased consistent growth throughout the year.
Understanding Profit and Loss Distribution
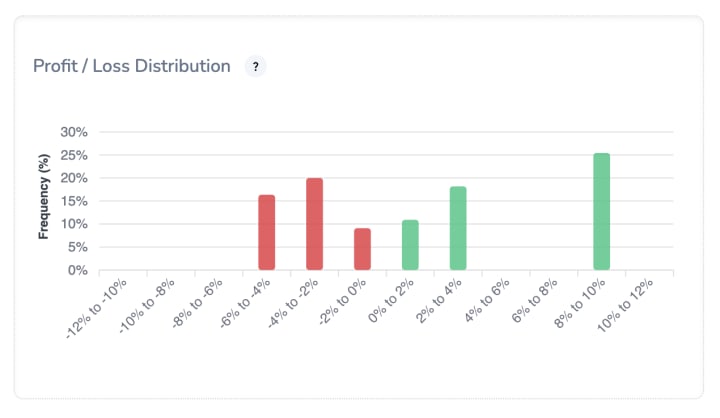
The Profit/Loss Distribution chart provides a clear visual representation of how the strategy’s trades performed in terms of percentage gains and losses. Each bar shows the frequency of trades falling within a specific profit or loss range.
In the chart, we see that the majority of losses fall between -2% to -4% and -4% to -6%, indicating controlled losses, likely due to the set -5% stop loss. On the profit side, a significant portion of trades ended in the 8% to 10% range, which aligns with the defined +10% take profit setting.
This distribution is important because it highlights the consistency of the strategy in adhering to the risk management rules and the overall balance between winning and losing trades. It also shows that the strategy successfully captures larger gains while keeping losses relatively small, contributing to its overall profitability.
Understanding Sell Reason Distribution
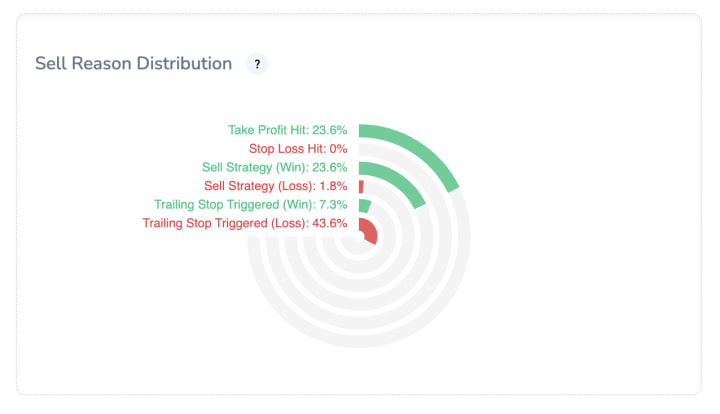
The Sell Reason Distribution chart provides a breakdown of why positions were closed during the backtesting period, offering insights into how the strategy performed under various market conditions:
- Take Profit Hit (23.6%): A significant portion of trades closed after reaching the predefined +10% take profit, capturing substantial gains.
- Stop Loss Hit (0%): No positions were closed due to hitting a stop loss because the strategy used a Trailing Stop Loss instead of a fixed stop loss.
- Sell Strategy (Win — 23.6%): 23.6% of trades were closed based on the sell strategy conditions and resulted in profits, highlighting the effectiveness of these rules.
- Sell Strategy (Loss — 1.8%): A small percentage of trades closed at a loss due to the sell strategy conditions being triggered but failing to produce a favorable market outcome.
- Trailing Stop Triggered (Win — 7.3%): 7.3% of trades were closed with profits when the trailing stop was triggered, locking in gains before the market reversed.
- Trailing Stop Triggered (Loss — 43.6%): The largest percentage of trades, 43.6%, were closed at a loss due to the trailing stop being triggered after the price moved unfavorably.
This distribution reflects how the strategy prioritized dynamic exit conditions, such as trailing stop losses, instead of static stop loss settings. It also suggests that further refinement of the trailing stop logic could help reduce the number of losses and improve overall profitability.
Detailed and Realistic Backtesting Logs
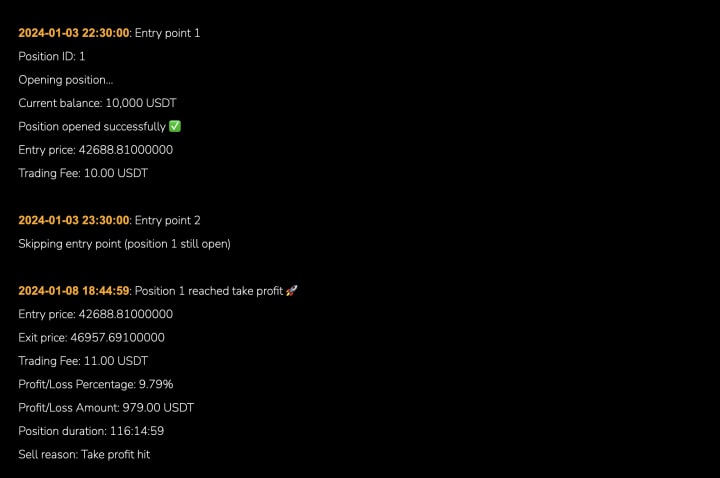
Unlike many other backtesting platforms that only provide basic results, our reporting goes further. It includes a detailed, time-based breakdown of exactly when the buy or sell conditions were met, ensuring you can validate that the strategy works as expected. Additionally, trading fees are automatically tracked and applied to each trade, mimicking real-world conditions for a more accurate and realistic outcome.
You can view the full results here. Plus, why not backtest your own trading strategy for free and see how it could have performed?
Next: Forward Test Your Strategy with Ease
After completing your backtest, you can seamlessly convert your strategy into a crypto trading bot for forward testing in demo mode—all without any coding. Forward testing uses real-time market data from your preferred exchange to simulate trades, allowing you to observe how your strategy performs under current conditions without risking real money. We support leading exchanges such as Binance, Binance.US, KuCoin, Bybit, OKX, BingX, and CoinEx.
Now, let’s walk through the simple steps to transform your strategy into a crypto trading bot using virtual funds!
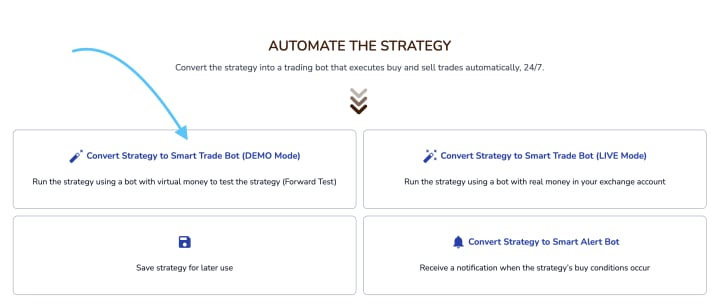
At the bottom of the backtest results page, simply click “Convert Strategy to Smart Trade Bot (Demo Mode).” When the modal appears, click “Save” to save your strategy before proceeding to the next step.
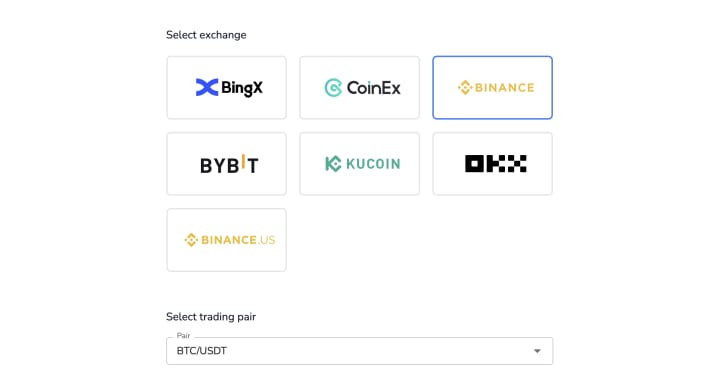
Next, select your preferred exchange and trading pair. For this example, we’ll choose Binance and BTC/USDT, but you’re free to pick any exchange and pair that suits your needs.
For example:
- Dynamic (25%): Opens positions with 25% of your balance (e.g., 250 USDT for 1,000 USDT spot wallet balance, 500 USDT for 2,000 USDT). This adjusts as your balance grows allowing you to auto-compound your investment over time.
- Static (100 USDT): Consistently opens positions with 100 USDT, regardless of balance changes.
Keep in mind, this applies to Live trading mode when the bot is connected to your exchange account for real-money trading. In Demo mode (forward testing), positions are always set to 100 USDT by default.
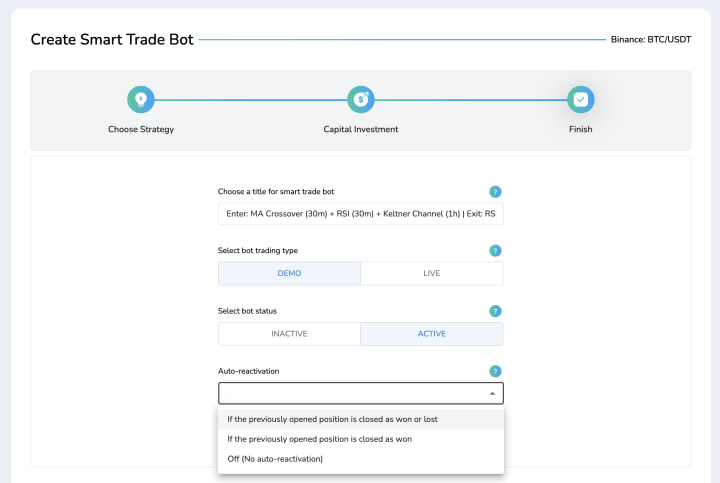
Finally, give your bot a name and select its status upon creation (either Active or Inactive). You can also specify how the bot should be auto-reactivated after a position is closed. For forward testing, we recommend setting it to reactivate as soon as the previous position is closed as won or lost, allowing the bot to continue testing seamlessly. This also supports Telegram notifications, keeping you updated on the bot’s latest activities in real time. You’ll always know when a position is opened, closed, or updated during forward testing. Finally, click on “Save”.
And that’s it! You’ve successfully created your strategy, backtested it, analyzed the results, and converted it into a trading bot in demo mode to perform forward testing.
Your trading bot is now actively monitoring the BTC/USDT pair on the Binance exchange 24/7, using virtual funds to simulate trades based on your predefined trading strategy. It also sends you Telegram notifications for every event, such as opening or closing a position, keeping you informed in real time.
Build, Test, and Trade with Confidence
With CryptoTailor.io, you can create a trading strategy, backtest it for free using up to 6 years of historical data, and forward test it in demo mode to evaluate its real-time performance. Once validated, seamlessly convert it into a Crypto Trading Bot and connect it to your favorite exchange for Automated Crypto Trading with real money. Transform your strategies into action with ease!
If you have any questions, feedback, or thoughts about this article, don’t hesitate to share them in the comments below—I’d love to hear from you and will be happy to help!
About the Creator
Behzad Khoshdouz
Software Engineer | MBA | Building automated trading solutions 🚀
Keep reading
More stories from Behzad Khoshdouz and writers in Trader and other communities.
TradingView Signal Automation (Paper Trading)
Curious about automating TradingView indicators and strategies using paper trading or virtual funds? In this guide, we’ll break down how it works and why demo mode is a crucial step for testing any TradingView indicator, strategy, or custom Pine Script before putting real money on the line. By executing trades in a fully simulated environment, you can monitor performance, fine-tune settings, and optimize strategies—all without financial risk. Once you’ve validated your approach in demo mode, you can seamlessly transition to live trading with confidence.
By Behzad Khoshdouz12 months ago in Trader
Australia Ceiling Fan Market: Energy Efficiency, Housing Activity & Climate Comfort
Australia Ceiling Fan Market Overview Australia’s ceiling fan market is evolving as households and commercial buildings increasingly focus on energy efficiency, climate comfort and cost-effective cooling solutions. The Australia ceiling fan market size reached USD 224.00 Million in 2024. Looking forward, IMARC Group expects the market to reach USD 292.78 Million by 2033, exhibiting a growth rate (CAGR) of 3.02% during 2025-2033. This growth reflects long-term structural trends rather than short-term consumer cycles, supported by residential construction activity, renovation demand and rising awareness of electricity consumption.
By Amyra Singh5 days ago in Trader
alex honnold net worth: How Fearless Climbing Turned Passion into Lasting Wealth
alex honnold net worth is the result of a rare mindset and years of brave choices. Alex Honnold became famous for climbing huge rock walls without ropes. This risky path was not about money at first. It was about focus, control, and love for climbing. Over time, his bold actions brought global attention. That attention helped turn passion into income. Today, alex honnold net worth reflects both courage and smart decisions.
By John.doe798about 10 hours ago in Trader


Comments
There are no comments for this story
Be the first to respond and start the conversation.