
Bitcoin Dominance Explained: What It Is & Why It Matters for Crypto Traders
A complete, in-depth guide for crypto traders & Bitcoin investors

Introduction
Bitcoin dominance is one of the most watched indicators in the crypto market. It shows how much of the total cryptocurrency market value belongs to Bitcoin compared to all other cryptocurrencies combined. Traders, long-term investors, and analysts track this metric because it helps explain capital rotation, market sentiment, and risk appetite across crypto cycles.
When Bitcoin dominance rises, it often signals that money is flowing into Bitcoin faster than into altcoins. This usually happens during uncertainty, early bull markets, or market downturns. When dominance falls, capital tends to rotate into altcoins, which many traders call altcoin season. Understanding this shift can help traders decide when to focus on Bitcoin and when to look for altcoin opportunities.
In this complete guide, you’ll learn exactly what Bitcoin dominance is, how it’s calculated, how traders interpret the Bitcoin dominance chart, and how dominance behaves during bull and bear markets. We’ll also explore real historical examples, common mistakes, advanced strategies, and the future outlook of Bitcoin dominance. Whether you’re new to crypto or already trading actively, this article will help you use Bitcoin dominance with more confidence and clarity.
What Is Bitcoin Dominance?
Bitcoin dominance represents the percentage of total crypto market capitalization held by Bitcoin. It does not measure Bitcoin’s price. Instead, it measures Bitcoin’s relative strength compared to the rest of the crypto market.
For example, if:
Total crypto market cap = $2 trillion
Bitcoin market cap = $1 trillion
Bitcoin dominance would be 50%.
This means half of all crypto value is concentrated in Bitcoin.
Bitcoin dominance matters because crypto markets are not static. Capital constantly moves between Bitcoin, altcoins, and stablecoins. Dominance helps track where money is going rather than focusing on price alone.
A rising Bitcoin price with rising dominance tells a different story than a rising Bitcoin price with falling dominance. One suggests capital flowing mainly into Bitcoin. The other suggests Bitcoin is rising, but altcoins are rising faster.
How Bitcoin Dominance Is Calculated
The formula for Bitcoin dominance is simple:
Bitcoin Dominance = (Bitcoin Market Cap ÷ Total Crypto Market Cap) × 100
Market capitalization is calculated by multiplying price by circulating supply. Most platforms update dominance in real time using aggregated data from exchanges.
Important calculation nuances:
Some platforms include stablecoins in total market cap
Others allow you to exclude stablecoins for cleaner analysis
Wrapped Bitcoin (WBTC) is usually counted as Bitcoin-related value but not always included directly
These differences explain why Bitcoin dominance percentages may vary slightly across platforms.
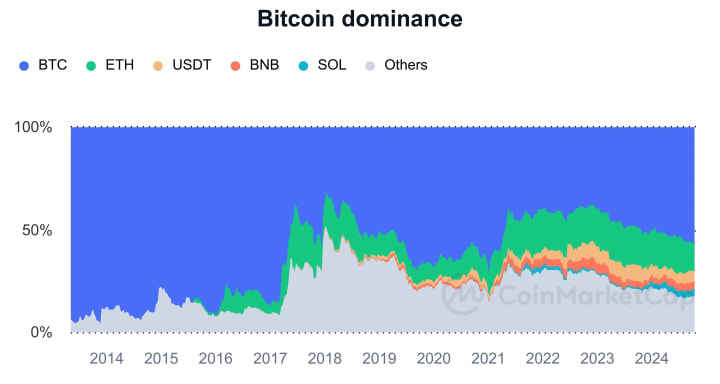
Understanding the Bitcoin Dominance Chart
The Bitcoin dominance chart (often labeled BTC.D) is typically shown as a percentage line chart. Traders analyze it the same way they analyze price charts.
Key elements traders watch:
Trend direction (uptrend or downtrend)
Support and resistance levels
Breakouts and breakdowns
Divergences with Bitcoin price
Bitcoin dominance trends tend to last longer than price trends. That’s why many traders use dominance as a macro indicator rather than a short-term trading signal.
History of Bitcoin Dominance
Early Years (2009–2016)
Bitcoin dominance was near 100%. Bitcoin was essentially the entire crypto market.
ICO Boom (2017)
Thousands of new tokens launched. Bitcoin dominance dropped below 40% as capital flooded into altcoins.
Bear Market (2018–2019)
Altcoins collapsed harder than Bitcoin. Dominance rose again above 60%.
DeFi & NFT Era (2020–2021)
Ethereum and DeFi tokens surged. Bitcoin dominance declined while the overall market expanded.
Recent Cycles (2022–2025)
Institutional interest, Bitcoin ETFs, and macro uncertainty pushed dominance higher again, reinforcing Bitcoin’s role as crypto’s primary reserve asset.
Why Bitcoin Dominance Matters
Bitcoin dominance helps answer questions price charts alone cannot:
Is capital moving into safety or speculation?
Are altcoins likely to outperform Bitcoin soon?
Is the market risk-on or risk-off?
Bitcoin dominance is often used as a context tool, not a standalone indicator. It adds meaning to price action.
Bitcoin Dominance and Trading Strategies
Traders use Bitcoin dominance in several ways:
1. Market Allocation
High dominance → focus on Bitcoin
Falling dominance → look for strong altcoins
2. Confirmation Tool
Bitcoin price rising + dominance rising = Bitcoin-led rally
Bitcoin price rising + dominance falling = altcoin-led rally
3. Risk Management
Dominance spikes often appear during market stress. Traders may reduce altcoin exposure when dominance starts breaking upward aggressively.
Bitcoin Dominance and Altcoin Season
Altcoin season usually occurs when:
Bitcoin price stabilizes after a rally
Bitcoin dominance trends downward
Capital rotates into mid- and low-cap coins
Falling dominance does not guarantee all altcoins will rise. Strong fundamentals and liquidity still matter.
Bitcoin Dominance in Bull vs Bear Markets
Bull Markets
Early phase: dominance rises as Bitcoin leads
Mid phase: dominance stabilizes
Late phase: dominance falls as altcoins surge
Bear Markets
Dominance usually rises as capital exits riskier assets
Bitcoin loses value slower than most altcoins
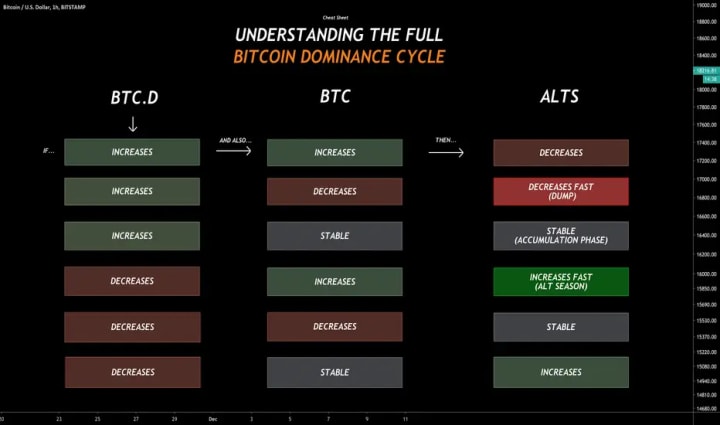
Bitcoin Price vs Bitcoin Dominance Scenarios
Bitcoin Price Dominance Interpretation
Rising Rising Capital flowing mainly into Bitcoin
Rising Falling Altcoins outperforming Bitcoin
Falling Rising Flight to safety within crypto
Falling Falling Broad market sell-off
Institutional Influence on Bitcoin Dominance
Institutions prefer:
Liquidity
Regulatory clarity
Market depth
Bitcoin satisfies all three better than most altcoins. ETF inflows, corporate treasuries, and custody solutions tend to increase Bitcoin dominance over time.
Limitations of Bitcoin Dominance
Bitcoin dominance has weaknesses:
Stablecoins inflate total market cap
New token launches distort ratios
Dominance doesn’t show which altcoins are strong
It should always be used alongside volume, price action, and market structure.
Tools to Track Bitcoin Dominance
Popular platforms include:
TradingView (BTC.D chart)
CoinMarketCap
CoinGecko
CryptoQuant (advanced analytics)
Most traders prefer TradingView for technical analysis and historical trend comparison.
Complementary Metrics to Use with Dominance
Altcoin dominance charts
Total crypto market cap (TOTAL)
Stablecoin dominance
Fear and Greed Index
Bitcoin volume dominance
Using multiple indicators improves reliability.
Real Case Studies
2017 Altcoin Explosion
Dominance fell sharply as ICO speculation peaked. Many altcoins later lost over 90% of value.
2020–2021 DeFi Boom
Bitcoin dominance declined gradually while the overall market grew massively — a healthier rotation.
2022 Bear Market
Dominance rose as altcoins collapsed faster than Bitcoin.
Future Outlook of Bitcoin Dominance
Bitcoin dominance may never return to 90%, but Bitcoin’s role as the core reserve asset of crypto remains strong. ETFs, institutional adoption, and regulatory clarity favor Bitcoin’s long-term dominance, even as innovation continues elsewhere.
Custom Visual Concepts

Infographic ideas:
Bitcoin dominance vs altcoin season timeline
Market cycle phases mapped to dominance trends
Capital rotation flow: Bitcoin → Large caps → Small caps
Alt text example: “Bitcoin dominance chart showing capital rotation between Bitcoin and altcoins over market cycles”
Quick Takeaways
Bitcoin dominance measures Bitcoin’s share of total crypto value
Rising dominance often signals risk-off behavior
Falling dominance can indicate altcoin season
Dominance works best as a macro indicator
Combine dominance with price, volume, and sentiment tools
Conclusion
Bitcoin dominance is not about predicting price. It’s about understanding where money is flowing inside the crypto ecosystem. Traders who ignore dominance often misread market structure and enter positions at the wrong phase of the cycle.
Used correctly, Bitcoin dominance adds context to every trade. It helps you stay aligned with market sentiment, manage risk better, and identify opportunities before they become obvious. Whether you trade Bitcoin, altcoins, or both, mastering dominance analysis gives you a clearer view of the bigger picture.
FAQs
1. What is a good Bitcoin dominance level?
There is no “good” level. It depends on market phase and risk conditions.
2. Does falling dominance mean Bitcoin will crash?
No. It often means altcoins are outperforming, not that Bitcoin is weak.
3. Can Bitcoin dominance predict altcoin season?
It can help identify conditions, but it’s not a guarantee.
4. Should beginners use Bitcoin dominance?
Yes, as a high-level market guide rather than a trading signal.
5. Is Bitcoin dominance still relevant in 2026?
Yes. Despite new assets, Bitcoin remains the market anchor.
About the Creator
saif ullah
Content writer on different niches, specially on finance.
Keep reading
More stories from saif ullah and writers in The Chain and other communities.
Blockchain in Intellectual Property: How It’s Changing Ownership, Protection, and Licensing
Introduction Intellectual property (IP) is one of the most valuable assets in the modern economy. From music, films, and books to patents, trademarks, and software code, creators and businesses rely on IP laws to protect their work. However, traditional intellectual property systems are often slow, expensive, and difficult to enforce—especially in the digital age.
By saif ullaha day ago in The Chain
Token Launch Strategies That Align With 2026 Market Expectations
The token launch landscape entering 2026 looks fundamentally different from the speculative cycles that defined earlier crypto eras. Market participants are no longer chasing short-term hype alone. Capital allocators, exchanges, regulators, and even retail users increasingly demand demonstrable product traction, governance clarity, compliance readiness, and sustainable economics. The collapse of several high-profile token launches during the 2022–2024 downturn exposed weaknesses in poorly structured tokenomics, inflated valuations, and superficial community building. In response, the market has matured.
By Jennifer Atkinson3 days ago in The Chain
Silence, Patterns, and Power: How Tom Bower Changed the Royal Conversation
For months, the royal conversation rippled with speculation. Claims multiplied, narratives twisted, and every whisper seemed to point back to the same names. But one man whose voice normally thundered across royal reporting said nothing—Tom Bower. Known for investigative aggression and fearless conclusions, Bower’s silence didn’t just feel unusual. It felt intentional. Observers noticed. Commentators asked where he’d gone. Why wasn’t he weighing in? And then came the realization: Tom Bower doesn’t react to noise. He studies the echo. While tabloids flung accusations and social media threads tied Meghan Markle to every flare-up inside the monarchy, Bower remained quiet. That wasn’t restraint—it was strategy. Bower had no interest in arguing rumor versus fact. His method relies on something far more revealing than gossip: institutional behavior. Silence as Data Where others saw unanswered questions, Bower saw an unfolding pattern. Inside Buckingham Palace, silence isn’t absence. It is a coded response. A pause. A calculation. A decision about what is worth engaging—and what is safer to ignore. Bower wasn’t analyzing the scandal itself; he was analyzing how the palace reacted to the scandal. Which stories were swatted away within hours? Which claims lingered unchallenged for months? Which headlines forced quiet restructuring behind closed doors? To Bower, these reactions told the real story—one about stress fractures and shifting roles inside the monarchy. The Meghan Variable What emerged from his study wasn’t accusation, but recurrence. Meghan Markle wasn’t presented as the source of crises—but as the constant in the room each time turbulence hit. Not triggering explosions, but always standing close enough for the shockwaves to force recalibration. This interpretation damaged no reputations legally—but it reshaped perception. Institutions don’t need villains. They react to pressure, not personalities. And by simply existing at the center of modern royal controversy—interviews, lawsuits, streaming projects, fractured family ties—Meghan represented unpredictability. In royal systems built on predictability, unpredictability reshapes behavior. The Palace Logic Palace advisers work from a simple, centuries-old rulebook: Threats to the Crown’s function are addressed Threats to the Crown’s image are absorbed You don’t fight every rumor—especially when fighting validates the rumor. Sometimes silence is not weakness but defense. To the public, silence feels mysterious. To the institution, silence is strategy. Harry’s Blind Spot Prince Harry’s story complicates this further. For him, silence meant abandonment. Lack of response confirmed neglect rather than restraint. Harry believed discussion was the solution, that acknowledgment could heal wounds. But the monarchy is not designed for emotional transparency. It is designed to outlast individuals, moods, and moments. And so, what looked like indifference to Harry was—according to Bower—calculated caution. When Bower Finally Spoke By the time Tom Bower broke silence, the ground had already shifted. Public trust in royal messaging had cracked. Media fatigue had set in. Sympathy moved from one side to another, then back again. Bower offered no new allegations. He offered explanation. He spoke about patterns—how silence itself becomes a reaction, how institutions prioritize stability over fairness, and how recurring storms force systems to distance rather than confront. His words reframed everything. Suddenly, the debate wasn’t: “Is this rumor true?” The question became: “Why does the palace treat this rumor differently?” That reframing turned speculation into a study of power. The Impact of Insight From the palace’s viewpoint, Bower’s words required no response—and they gave none. Engagement would elevate. Silence would deflate. For Meghan and Harry, the shift was subtle but significant. It challenged the narrative that ignoring them meant irrelevance or denial. Instead, it suggested strategic containment. The media world, weary of royal upheaval, reacted differently. Producers didn’t panic—they paused. Not because Bower exposed wrongdoing, but because he illuminated the operating system behind the monarchy’s reactions. And once a system is visible, it is harder to ignore. The Conversation Evolves Tom Bower didn’t break silence to drop bombs. He broke silence to show how bombs are diffused—even when no explosion is heard. His intervention changed nothing on paper: No policies, no statements, no public apologies. Yet it changed everything in perception. He taught audiences to stop listening only to what is said—and start studying what is left unsaid. And in the end, that insight may be more disruptive than any accusation. Because once silence stops looking accidental and starts looking deliberate, distance becomes clarity— and the story begins to write itself.
By Behind the Curtain5 days ago in The Chain
Miss Persephone's Manual to a Seemingly Ordinary Life
Miss Persephone was found at the dining table, her blue eyes swollen, her tears arriving and retreating like the tides of the ocean. Earlier that day, her family had visited her in the retirement home where she had lived for eight years. It was her eightieth birthday.
By Imola Tóth2 days ago in Fiction


Comments
There are no comments for this story
Be the first to respond and start the conversation.