
The ROI of Android Test Automation: What to Measure and How
Maximising Value from Mobile Testing – Key Metrics That Prove the ROI of Android Test Automation

Android apps today must be delivered quickly, frequently, and with high reliability. Users expect seamless performance, and businesses can't afford costly delays or post-release bugs. To support this pace of delivery, test automation has become a cornerstone of modern mobile development workflows.
But implementing automation alone isn’t enough. To justify the investment of time, tooling, and personnel, teams need to measure the return on investment (ROI). Without clear metrics, it’s difficult to assess the true value of automation—or know where to improve it.
Why Measuring ROI in Test Automation Matters
Without data, test automation risks becoming a time sink rather than a strategic asset. Tests may execute reliably, but if they fail to reduce manual effort, improve quality, or enable faster releases, they’re not delivering meaningful value.
ROI measurement helps teams:
- Evaluate whether automation is reducing costs or just shifting them.
- Quantify gains in test coverage, defect detection, and release velocity.
- Plan resourcing for automation initiatives more effectively.
- Communicate benefits to leadership with data-driven reporting.
- Drive continuous improvement by identifying performance gaps.
When implemented effectively, automation should accelerate feedback loops, reduce regression cycles, and deliver stability—without increasing maintenance burdens.
Key Metrics to Track Android Test Automation ROI
1. Test Coverage
The percentage of your app’s functionality, screens, or codebase covered by automated tests.
How to track:
- Unit test coverage can be measured using tools like JaCoCo or Kover to analyze code paths exercised by unit tests.
- UI flow coverage can be visualized via automated flow maps or maintained manually to track which screens and journeys are tested.
- Device/OS coverage involves tracking which combinations your test suite runs on—especially critical in the Android ecosystem.
Why it matters:
High test coverage reduces the risk of regressions. But raw numbers can be misleading—what matters more is covering critical paths and high-risk areas. 100% coverage of low-impact code means little if major flows go untested.
2. Regression Cycle Time
The time it takes to execute all regression tests before a release.
How to track:
- Record the duration of manual regression before automation.
- Compare it to automated runs across multiple sprints/releases.
- Use CI logs to timestamp start and end of test phases.
Why it matters:
Faster regression cycles mean shorter feedback loops and faster delivery. This metric is key for agile and DevOps teams aiming for frequent release cycles. Automation should reduce regression from days to hours—or even minutes.
3. Bug Escape Rate
The percentage of bugs that reach production despite testing.
Formula:
(Defects in production ÷ Total defects found across environments) × 100
Why it matters:
A high escape rate suggests gaps in test coverage or effectiveness. Over time, automation should reduce escapes, especially for known patterns and previously fixed issues. A consistently low escape rate signals that your automation is catching what matters before it impacts users.
4. Test Execution Time
The total time taken to run your entire automated test suite.
How to track:
Use your CI/CD tool (e.g., Jenkins, GitHub Actions) to log execution start and finish timestamps.
Break down time per test category: unit, integration, UI.
Why it matters:
Lengthy test runs slow down pipelines and delay deployments. A well-optimized suite runs in parallel, skips redundant tests, and finishes quickly—maximizing the benefit of automation without creating delivery friction.
5. Test Maintenance Effort
The time or effort required to maintain existing automated tests.
How to track:
- Log the number of hours spent fixing broken tests per sprint.
- Track the frequency of test updates due to app or UI changes.
- Record how often test failures are unrelated to actual bugs.
Why it matters:
High maintenance costs erode ROI. Frequent UI changes in Android apps—like layout updates, navigation redesigns, or text changes—can break brittle tests. The goal is to reduce script fragility through better design and smarter tooling.
Intangible Indicators of ROI
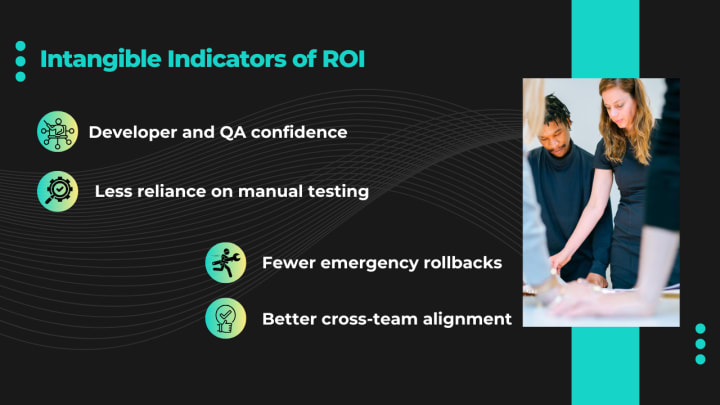
Not every benefit is easily measurable, but these signals indicate healthy automation ROI:
- Developer and QA confidence: Teams trust automation results and use them to guide decision-making.
- Less reliance on manual testing: Smoke, sanity, and even exploratory testing require fewer human hours.
- Fewer emergency rollbacks: With better pre-release test coverage, critical bugs are caught early.
- Better cross-team alignment: Shared visibility into test outcomes improves collaboration between QA, developers, and product stakeholders.
These intangible gains are often what truly unlock scale and speed in Android delivery workflows.
Tools That Help Measure and Maximize Test Automation ROI
Here’s a comparison of widely used tools that support Android test automation while helping track or maximize ROI:
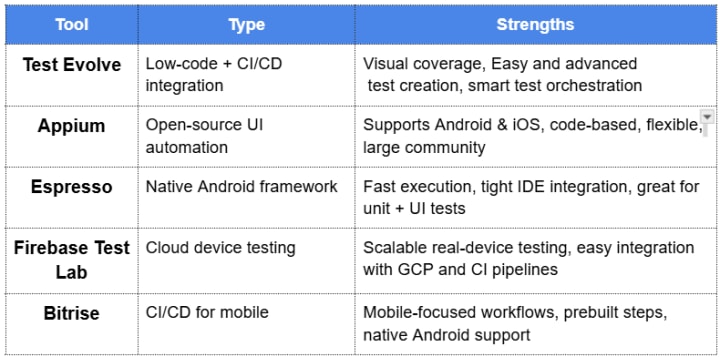
These tools vary based on:
- Technical team maturity
- Project scale
- Integration needs
- Budget and hosting preferences
Teams often combine multiple tools (e.g., Espresso + Firebase, or Appium + Bitrise) depending on use case.
How to Get Started With ROI Tracking
If you're just beginning to evaluate test automation ROI, here’s a practical starting point:
Choose a small test suite or feature as a pilot
Focus on high-impact, frequently-used functionality to maximize visibility.
Log current metrics:
- Test execution times
- Manual testing effort
- Defect counts and escape rates
Implement automation and observe over 2–3 sprints
Measure improvement across the same metrics.
Use CI/CD-integrated tools to auto-capture data
Tools like GitHub Actions, Jenkins, or Firebase Test Lab log execution times and failures by default.
Present your findings in retrospectives
Share measurable wins with stakeholders to secure buy-in for scaling automation.
Conclusion
Android test automation can offer massive benefits—from faster delivery and better quality to stronger collaboration. But without measurement, it's impossible to know whether you're getting the full value from your investment.
By tracking the right ROI metrics—coverage, execution time, escape rate, and more—you can identify gaps, cut waste, and make informed decisions about where to scale automation next.
Whether you’re just getting started or trying to refine your existing approach, aligning automation goals with business outcomes is the key to long-term success.
If you're looking for practical guidance on where to begin, join our upcoming session:
Get Started with Mobile App Test Automation for Android
📅 Date: Thursday, 10 April 2025 | ⏰ Time: 17:00–18:00 BST
What you’ll gain:
✔️ APK management essentials
✔️ Element locator strategies that scale
✔️ How to use Page Object patterns to structure your tests for long-term maintainability
✔️ Real-device and emulator testing
✔️ Built-in integrations with leading platforms
✔️ Rich, actionable test reporting
🔗 Register here: https://www.eventbrite.com/o/test-evolve-57581467393
About the Creator
Barrick Weighs Sale of Gold Mine to Discovery Silver
Barrick Gold Corporation, one of the world’s largest gold producers, is reportedly considering the sale of one of its gold mining assets to Discovery Silver Corp., a junior miner focused on silver and precious metals exploration. The potential transaction reflects a broader trend of strategic portfolio optimization in the mining industry, as companies reassess core operations, prioritize high-return assets, and adapt to shifting market dynamics.
By Salaar Jamaliabout an hour ago in Journal
Whiskey At Dusk
Guess the whiskey was more important to you in the end, wasn’t it? It was more than the well-being of your friends; more vital than showing up to the places you promised you would and could come to; more critical of a matter than fulfilling your damn responsibilities and getting the press off your back.
By Snarky Lisa8 days ago in Humans


Comments
There are no comments for this story
Be the first to respond and start the conversation.