
Customer Segmentation using k-prototypes algorithm
Cluster analysis with k-prototypes algorithm of Smartwatch survey data.


Why do we need to segment the market?
Whether real or perceived, customers have a wide range of demands and preferences, which is a fundamental assumption. Consider how much research, trial and error, and peer reviews you undergo before purchasing any product. It is because everyone has unique needs, desires, wants, preferences, etc. And firms have to consider and manage this customer heterogeneity to fulfill customers' demands and preferences. Thus, according to Palmatier and Sridhar, 2017 this provides us first foundational marketing principle i.e.

MP#1 -> All customers differ
Customer heterogeneity is a fundamental "issue" that all firms must consider when building a successful marketing plan since naturally, customers differ in their preferences for products and services in so many ways. Assuming that all consumers are the same can only work for exceptional cases like monopolies or utilities; otherwise, other firms will inevitably continue to grab a slice of pizza, i.e., to target niche markets with better-suited offers.
And to manage customer heterogeneity, we have several approaches, STP analysis being one of them. STP stands for Segmenting, Targeting, and Positioning.
Here we are only talking about how to segment the customers. Segmenting is the process of reducing the overall market into cohorts, with each cohort having similar needs and preferences. Again there are so many approaches to segment the customers, but we will focus on the data-driven approach, specifically Cluster analysis to segment the customers.
I am assuming you are already familiar with this unsupervised machine learning technique-Cluster analysis. If not then still, you can continue but I would highly recommend going through the concepts once.
Data
Moving ahead, let's talk about the data. Because I think this is the most interesting part of the analysis. I picked the data from the resources section of the companion website of the book Marketing Strategy: Based on First Principles and Data Analytics by Palmatier and Sridhar. One thing I would like to mention that I am heavily inspired by this book. And if you are interested in a data-driven marketing strategy then I would highly recommend this book.
You can buy this book from below.
We have a survey data of 1000 alumni of the University of Oregan's Lundquist College of Business on their preferences for Smartwatch features, and some demographic information.
Ok before moving further, you must read the background, problem statement, and information about data in detail here. And you can find the excel sheet here.
Implementation
First I would like to thank my friend Harsh Panchal for his help and support in this project.
We considered k-prototypes algorithm which is, you can say, a mixture of k-means and k-modes. The reason to use k-prototypes algorithm was that it can handle both numerical and categorical features simultaneously.
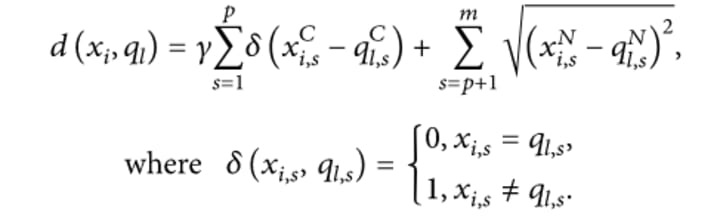
Jia and Song in their article[1.] stated that the k-prototypes algorithm combines the "means" of the numerical part and the "modes" of the categorical part to build a new hybrid Cluster Center "prototype". Based on the "prototype", it builds a Dissimilarity Coefficient formula and the Cost Function applicable to the mixed-type data.
The parameter γ is introduced to control the influence of the Categorical Feature and the Numerical Feature on the clustering process. It is assumed that the mixed-type dataset has p Numerical Feature and m-p Categorical features. For any xi, qi ∈ D, the definition of the Dissimilarity Coefficient of k-prototypes is shown in the following formula:
It was all in theory, in practice you just simply have to:
- Install kmodes package.
- Import KPrototype from kmodes.kprototypes.
- Convert the datatype of numeric columns to float.
- Give array as input data rather than a DataFrame.
- Explicitly give the list of columns that are categorical while fitting your data.
And now, rather than rehashing everything, I figured I'd just add the link to the notebook in my GitHub repository here. So, here's the link:
Check it out, and let me know if you feel I've messed up something or if you think the project can be improved.
References
- Ziqi Jia and Ling Song, "Weighted k-Prototypes Clustering Algorithm Based on the Hybrid Dissimilarity Coefficient", Hindawi Mathematical Problems in Engineering, Volume 2020, Article ID 5143797
- Robert W. Palmatier and Shrihari Sridhar, 'Marketing Strategy: Based on First Principles and Data Analytics ', 2017, pg no. 35–44
- Conor Henderson, Shrihari Sridhar and Alejandro Lerza Durant, 'Marketing Strategy: Based on First Principles and Data Analytics, Data Analytics Case 1 ', 2017
About the Creator
Shivam Soliya
Here to write about Businesses | Business & Marketing Strategies | Data analysis
Linkedin: www.linkedin.com/in/shivam-soliya-a5b08b1b5/
Instagram: www.instagram.com/shivam_soliya/
Keep reading
More stories from Shivam Soliya and writers in Journal and other communities.
The Quiet Link Between Evening Light and Restless Sleep
For a long time, I believed my restless sleep was caused by what happened in my head. Too much thinking. Too much stress. Too many unfinished thoughts that followed me into the night. I tried calming routines, earlier bedtimes, and stricter boundaries around work. Some nights improved. Many did not.
By illumipure5 days ago in Journal


Comments
There are no comments for this story
Be the first to respond and start the conversation.