
A report on stress
A report on stress-strain diagrams of different ductile and brittle materials.

Stress:
Stress is a quantity that describes the magnitude of forces that cause deformation.
Strain:
An object or medium under stress becomes deformed. The quantity that describes this deformation is called strain.
Stress-Strain Curve:
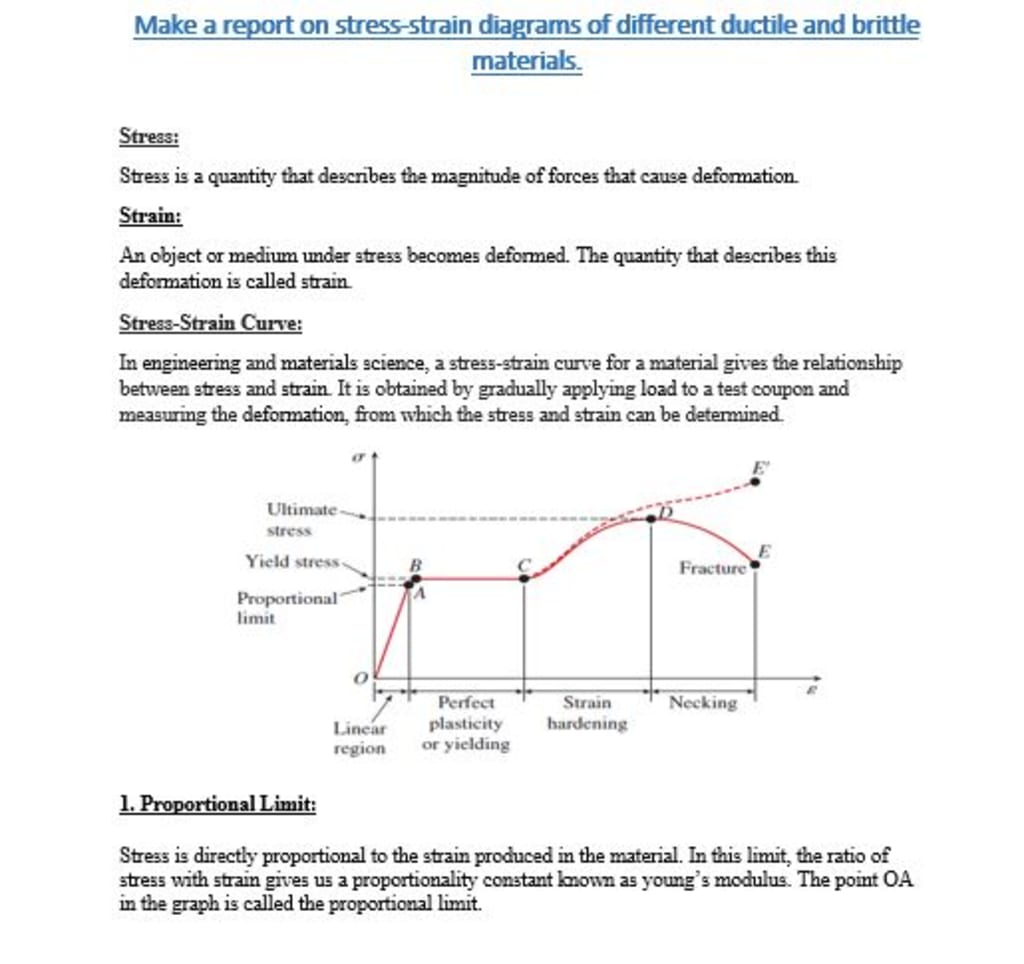
In engineering and materials science, a stress-strain curve for a material gives the relationship between stress and strain. It is obtained by gradually applying load to a test coupon and measuring the deformation, from which the stress and strain can be determined.
1. Proportional Limit:
Stress is directly proportional to the strain produced in the material. In this limit, the ratio of stress with strain gives us a proportionality constant known as young’s modulus. The point OA in the graph is called the proportional limit.
2. Elastic Limit:
It is the point in the graph up to which the material returns to its original position when the load acting on it is completely removed. Beyond this limit, the material cannot return to its original position and a plastic deformation starts to appear in it. Point A is the Elastic limit in the graph.
3. Yield Point or Yield Stress Point:
The yield point in a stress-strain diagram is defined as the point at which the material starts to deform plastically. After the yield point is passed there is permanent deformation develops in the material and which is not reversible. There are two yield points and it is upper yield point and the lower yield point. The stress corresponding to the yield point is called yield point stress. Point B is the upper yield stress point and C is the lower yield stress point.
4. Ultimate Stress Point:
It is the point corresponding to the maximum stress that a material can handle before failure. It is the maximum strength point of the material that can handle the maximum load. Beyond this point the failure takes place. Point D in the graph is the ultimate stress point.
5. Fracture or Breaking Point:
It is the point in the curve at which the failure of the material takes place. The fracture or breaking of material takes place at this point. The point E is the breaking point in the graph.
Mechanical Properties of Materials
The mechanical properties of a material are those which affect the mechanical strength and ability of a material to be molded in a suitable shape.
Malleability:
Malleability is a property of a material by which it can be beaten to form thin sheets. Most metals are malleable. Examples of malleable metals are zinc, iron, aluminum, copper, gold, and silver.
Ductility:
In materials science, ductility is defined by the degree to which a material can sustain plastic deformation under tensile stress before failure. Or the ability to be hammered thin or stretched into wire without breaking. Examples: Most metals are good examples of ductile materials, including gold, silver, copper, erbium, terbium, and samarium.
Strength:
In the mechanics of materials, the strength of a material is its ability to withstand an applied load without failure or plastic deformation. The field of strength of materials deals with forces and deformations that result from their acting on a material.
Brittleness:
Brittle materials have a small plastic region and they begin to fail toward fracture or rupture almost immediately after being stressed beyond their elastic limit. Bone, cast iron, ceramic, and concrete are examples of brittle materials.
Hardness:
Hardness is a measure of how much a material resists changes in shape. Hard things resist pressure. Some examples of hard materials are diamond, boron carbide, quartz, tempered steel, ice, granite, concrete. The ability of the material to resist wear, tear, scratching, abrasion cutting is called hardness.
Stress-Strain diagram for some ductile and brittle materials
• Ductile Materials:
In the case of ductile material, we have chosen copper. The reason to choose copper is simple as copper can be formed and stretched into complex and intricate surfaces without breaking. The very small diameter wires, which transmit power in cars, computers, televisions, lighting, and mobile phones only exist because of the high ductility and malleability of copper.
Stress-Strain Diagram For Copper:
Explanation:
a Normal stress-strain curve for copper shows the yield stress that occurs after the elastic region, the plastic zone, the tensile strength, and elongation at rupture. The Young's modulus for copper is 110 GPa. Data for this figure was taken from The Physics of Solids, by R. Turton. b Normal stress-strain curve for BSG showing that there is only a linear elastic region up to the tensile strength. Young's modulus for BSG is 62 GPa.
• Brittle materials
In the case of brittle materials ceramic is chosen as the two most common chemical bonds for ceramic materials are covalent and ionic. For metals, the chemical bond is called the metallic bond. ... That is why, generally speaking, metals are ductile and ceramics are brittle. Due to ceramic materials' wide range of properties, they are used for a multitude of applications.
Stress-Strain Diagram For Ceramic:
Ceramics usually are brittle. Observing the diagram, we verify this is significantly simpler than the previous. The main reason is that there is a very narrow plastic region. That’s why the fracture limit (point 2) is the same as the ultimate strength.
About the Creator
Saad Jutt
As a student-inspired writer, I am passionate about crafting powerful narratives that explore the complexities of the human experience and connect with readers on an emotional level.
The Neuroscience of Ritual: Bridging Ancient Practice and Modern Science
The Lesser Banishing Ritual of the Pentagram (LBRP) traces its lineage to a Hebrew prayer for protection. Over centuries, this modest invocation transformed into a formalized practice within the Hermetic Order of the Golden Dawn in the late nineteenth century — a practice that now resonates in esoteric traditions and neuroscience.
By Vongani Bandi8 days ago in FYI


Comments
There are no comments for this story
Be the first to respond and start the conversation.