
Satellites show that ice loss at Earth's poles is gradually getting worse.
Polar ice speed is measured using satellites.

Polar ice sheets do not suddenly break or collapse, according to satellite data. They slip most of the time, slowly and unrelentingly. Massive rivers of ice flow towards the sea every day from the centres of Antarctica and Greenland. The amount of ice that ends up in the ocean and the rate at which sea levels rise are determined by this motion.
Scientists battled for years to consistently and clearly track that movement. Regular observations were practically impossible due to snowstorms, months of darkness, and sheer distance. That image has now been altered by a ten-year satellite record. For the first time, scientists are able to observe the ice flow continuously from week to week and year to year over both continents.
This long-term perspective is important. Ice speed is more than a feature. It is one of the best indicators that scientists have for figuring out how quickly the planet's frozen giants are reacting to global warming.
Polar ice speed is measured using satellites.
The dataset records ice-flow rates over the whole Antarctic and Greenland ice sheets between 2014 and 2024. Polar winters are as apparent as summer days because to radar sensors that can see through clouds and darkness.
According to the maps, ice can move up to 50 feet per day in certain locations and as little as 3 feet per day in others. Because much of the ice along Antarctica's coast was monitored every six to twelve days, scientists were able to identify changes that had previously gone unreported.
Jan White of ENVEO IT, the study's lead author, succinctly described the change. "A significant obstacle to long-term climate records prior to the launch of Sentinel-1 was the lack of consistent SAR observations over polar glaciers and ice sheets," White stated.
"Today, the resulting velocity maps provide an exceptional view of ice-sheet dynamics, offering a dependable and crucial data record for comprehending polar regions in a rapidly changing global climate."
The slow acceleration of Antarctica
One glacier stood out on the western edge of Antarctica. At the point where the ice lifts off the ground and starts to float, Pine Island Glacier—which is already well-known for its instability—showed a consistent increase in speed. The flow there increased from roughly 34.8 feet per day to 41.7 feet per day over the course of the ten-year record.
The nearby glaciers accelerated as well. These changes are linked by scientists to thinned floating ice shelves, warmer ocean water, and an inland shift in the grounding line.
Large areas of East Antarctica, which was formerly believed to be mostly stable, are captured by the data. Even though there aren't as many changes, having a baseline makes it easier to identify changes in the future.
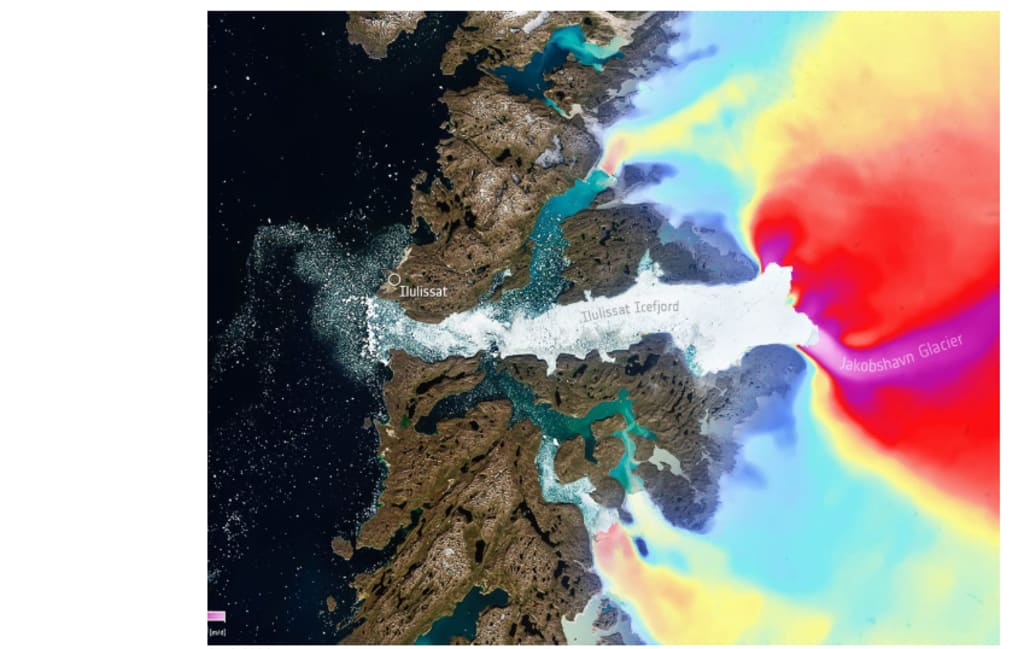
The fastest ice rivers in Greenland
A contrasting story, one characterised by incredible speed, is told in Greenland. Ice is funnelled towards the sea by a number of outlet glaciers at an average daily pace of up to 49 feet (15 meters). One of the fastest glaciers on Earth is Sermeq Kujalleq, which has occasionally achieved speeds of up to 164 feet (50 meters) per day.
The North-East Greenland Ice Stream starts farther inland close to the ice divide, where very little ice moves. From there, it carries ice as it stretches towards the coast like a frozen motorway.
The level of detail is astounding. Scientists can monitor ice movement over valleys, ridges, and grounding zones with resolutions as low as 650 to 820 feet (200 to 250 meters), recording movement over time spans of less than a week or more than ten years.
Why sea levels are affected by speed
The velocity of ice is not a number. It provides scientists with information on the amount of ice being released into the ocean. Future sea-level rise projections are directly influenced by that discharge.
The World Meteorological Organisation reports that melt water from land-based ice and warmed ocean water expanding are the two primary causes of rising oceans. That second category is dominated by Greenland and Antarctica. If they were completely lost, the combined amount of ice they contain would cause the world's sea levels to rise by tens of feet.
Coastal areas are already being impacted by even the present levels of ice loss. For many areas, erosion, higher storm surges, and flooding are now real risks.
A polar ice satellite
The monitoring of polar regions has changed as a result of the satellite mission that produced this record. Its radar equipment, which is almost 40 feet (12 meters) long, functions in a fashion that permits continuous imaging in the absence of clouds or darkness. The change was described by ESA's Sentinel-1 Mission Manager, Nuno Miranda.
Prior to Sentinel-1, it was necessary to combine data from various sensors over a number of years in order to produce such results. Thanks to scientific advancements, these data are now generated annually and even monthly with Sentinel-1, according to Miranda.
This innovation makes it possible to monitor these isolated locations with previously unheard-of temporal resolution. It is a crucial tool as the Arctic is warming at an unprecedented rate in 2025, necessitating closer and more regular observation.
Additionally, the project has increased the use of radar interferometry, making it possible to measure ice motion across far broader areas than previously.
Creating a record for the future
Sentinel-1D, a fourth satellite, will be launched at the end of 2025 to restore and enhance coverage across Antarctica and Greenland. It is now feasible to conduct routine observations every six days or less.
The Copernicus Climate Change Service now generates the ice velocity products. The European Centre for Medium-Range Weather Forecasts' Joaquín Muñoz Sabater gave a clear explanation of their function.
According to Muñoz Sabater, "the ice velocity time series for Antarctica and Greenland are an essential component of the C3S Cryosphere Service and a key contribution to monitoring the impacts of global warming in some of the world's most sensitive regions."
To further expand the record, future plans call for combining this data with radar from the forthcoming ROSE-L mission.
The study's co-author and CEO of ENVEO IT, Thomas Nagler, stressed the importance of the satellite record.
According to Nagler, "Sentinel-1 transformed our understanding of polar ice sheets by providing continuous, weather-independent radar measurements that reveal ice motion in unprecedented detail, transforming ice flow from a sparse snapshot into a dynamic, measurable process."
"Building on this legacy, the upcoming ROSE-L mission's integration with Sentinel-1 will further enhance ice-flow observations, enabling more accurate and stable monitoring of ice-sheet dynamics."
About the Creator
Keep reading
More stories from Francis Dami and writers in Futurism and other communities.
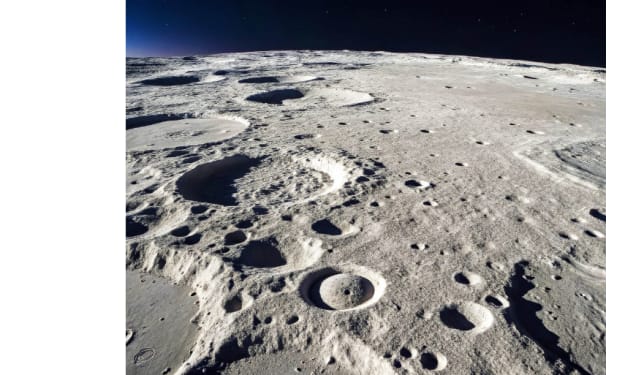
Contrary to popular perception, far-side observations show that Earth's moon is not "dead."
For a long time, the moon appeared to be a world that had completed its major transformations before becoming silent. Although there are still scars on its surface from heavy impacts and past lava floods, many experts have viewed such features as remnants of a far older era.
By Francis Dami7 days ago in Futurism
About Binding Prometheus
I want to start actively advocating on behalf of my own work, and the most valuable part of my canon is, without a doubt, Binding Prometheus, the play I have been working on since 2019 and only finished in 2023 as part of my MA. The play itself is an amalgamation of a million different inspirations. On one end, it evokes the Ancient Greek myth-play, deriving its own title from the earliest extant work of Western drama we have, Aeschylus’s Prometheus Bound. On the other end, it borrows significantly from the sci-fi bulwarks from over the years, namely Mary Shelley’s Frankenstein and Karel Capek’s Rossum’s Universal Robots. The play could be an episode of Black Mirror, I fear. I don’t know. I’ve only ever seen one episode of Black Mirror.
By Steven Christopher McKnight19 days ago in Futurism
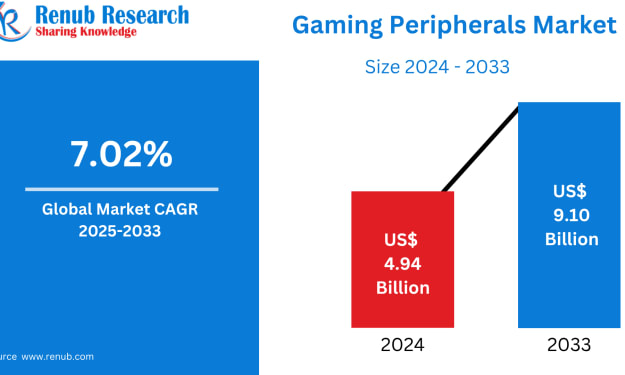
Gaming Peripherals Market Size and Forecast 2025–2033
Gaming Peripherals Market: An Industry in Rapid Transformation The global gaming peripherals market is entering a decisive growth phase as gaming continues to evolve from a leisure activity into a mainstream form of digital entertainment and professional competition. According to Renub Research, the Gaming Peripherals Market is expected to grow from US$ 4.94 billion in 2024 to US$ 9.10 billion by 2033, registering a compound annual growth rate (CAGR) of 7.02% from 2025 to 2033. This expansion reflects not only the surging popularity of gaming worldwide but also the rising demand for high-performance devices such as gaming mice, mechanical keyboards, headsets, controllers, and other immersive accessories.
By Aaina Oberoi7 days ago in Futurism


Comments
There are no comments for this story
Be the first to respond and start the conversation.