

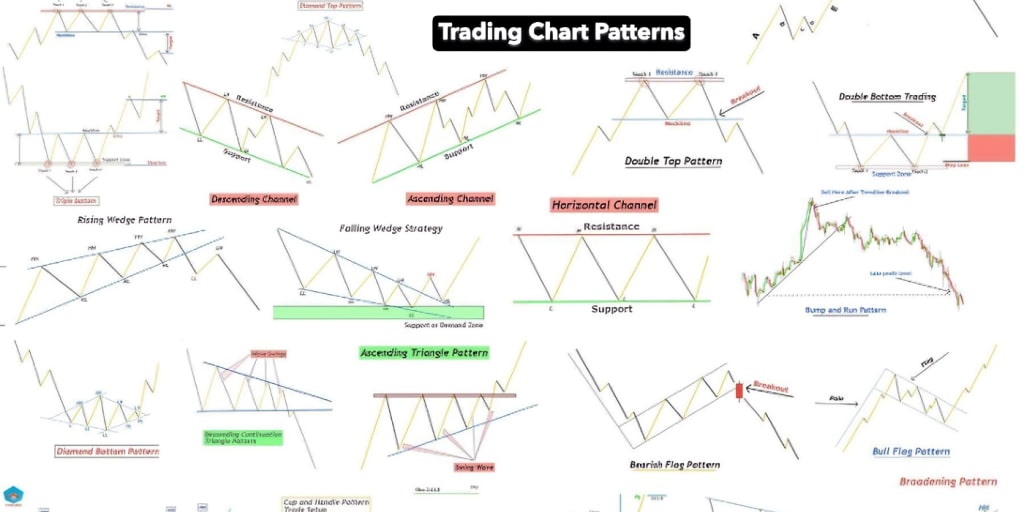
What Are Trading Chart Patterns?
In the context of trading chart patterns, chart patterns are geometric formations that appear on price charts. These formations occur when stock prices increase or decrease in a particular manner. After analysing these patterns, we can reliably determine whether the price will increase, decrease, or stabilise.
Why Are Trading Chart Patterns Important?
Chart trading patterns offer the following advantages to traders:
- Recognise the best times to buy or sell a stock
- Track the movements of market forces
- Control unnecessary emotional impulses
Trading becomes simpler when traders rely on predefined patterns to identify price movements.
Types of Trading Chart Patterns
There are three primary categories of trading chart patterns:
1. Continuation Patterns
Such patterns signify that the price will continue to move within a predefined range.
Examples:
- Flag
- Pennant
- Rectangle
2. Reversal Patterns
These patterns suggest the possibility of a change in the prevailing trend.
Examples:
- Head and Shoulders
- Double Top / Bottom
- Inverse Head and Shoulders
3. Bilateral Patterns
Such patterns indicate that the price movements could result in an increase or decrease.
Illustrations:
- Symmetrical Triangle
- Wedge Pattern
Top 3 Trading Chart patterns
1. Head and Shoulders Pattern
The Head and Shoulders pattern is considered one of the most well-known reversal trading chart patterns. The formation of this pattern occurs when the price reaches three peaks — the middle peak (head) is the highest, while the two side peaks (shoulders) are smaller and relatively equal. This pattern indicates that an uptrend is ending when the price breaks below the support line, also referred to as the neckline. There is also an Inverse Head and Shoulders pattern which signifies a reversal from downtrend to uptrend. This particular pattern is very useful in determining an ideal exit point for buy trades or optimal entry points for sell trades.
2. Patterns of Double Tops and Double Bottoms
Both Double Top and Bottom patterns are used as reversal trading chart patterns. This happens in the chart price movement is called a Double Top when the marks reach a certain peak price and retest the same peaks twice before falling away forming an M shape. This usually indicates that the price increase within the market is coming to an end and there is a possibility of a decrease in the future. However, a Double Bottom forms when the price hits the same low point twice and then rises form an approximate W shape. This indicates that the price will increase which means a bullish reversal. Even with their simplicity, these patterns are extremely effective in identifying market behaviour shift because the market previously traded within a specified range.
3. Triangle Pattern
In technical analysis, a triangle pattern indicates that the price is about to move decisively in one direction, signalling either a continuation or a breakout. This pattern is formed when the price movements of a particular asset over time, together with its peaks and troughs, begin to converge to form a triangular shape. The three subcategories include Ascending Triangle, which is a pattern where price makes higher lows and may break upward; Descending Triangle, which is characterised by price making lower highs and may break downward; and Symmetrical Triangle, which is where the price is expected to break in any direction. With a strong breakout from the triangle in either direction and volume expansion, traders receive a credible signal for trade entry in that direction.
A Comprehensive Understanding of Trading Chart Patterns
A sophisticated understanding of trading chart patterns entails that you;
- Consistently assess price charts.
- Understand support and resistance levels
- Look out for breakouts accompanied by increased volume
- Engage in practice using demo trading systems.
With time, you will seamlessly identify trading chart patterns.
Common Errors Associated with Chart Patterns Usage
To avoid using trading chart patterns, these errors should not be made:
- Preemptive movement without confirmation.
- Oversight of trade volume.
- Pattern dependency (diversity in tools is crucial).
- Failure to adjust based on previous mistakes.
- There is no reason not to verify before making a trade.
Most Effective Tools For Chart Patterns
Identifying trading chart patterns is easy with these free and paid tools:
- TradingView - Accessible interface with complimentary chart patterns.
- Forexfactory.com - Best for Forex
- MetaTrader - Good for Forex and stock charts.
- Invest.com - Great for novice traders.
- Chartink (India) – Best for Indian stocks.
These resources simplify identifying and applying trading chart patterns.
In Closing
Trading chart patterns provide clear signals for entering and exiting trades. With iterative practice, professionalism, and skillful reliance on discretion, you can actively utilise trading chart patterns to enhance your trading acumen.
About the Creator
Amit Pandey
The Put Call Ratio shows market sentiment through options data, types of candlesticks reveal price action, the MMI Index tracks market emotions, and chart patterns help predict price trends.
Keep reading
More stories from Amit Pandey and writers in Education and other communities.
🅼🅸🅳🅽🅸🅶🅷🆃 🆂🅽🅰🅲🅺🆂
"It's 10 in Tuscon! We all know what that means... It's Time for Midnight Snacks with your man, Gerald Gee! Ready to spend the night together? Me too! I'm full of snacks and can't wait to regurgitate them all back into your hungry ears. Crack a brew! Pop some corn! Anything to get ready for one hell of a show where the talk maybe cheap but the words cut deep...
By Lamar Wigginsa day ago in Fiction


Comments
There are no comments for this story
Be the first to respond and start the conversation.