
Supply And Demand Indicator
Supply And Demand Indicators

Introduction:
The supply and demand indicator is a popular technical analysis tool used by traders to identify potential price movements in the market. This indicator is based on the principles of supply and demand, which are the fundamental drivers of market prices. In this blog post, we will discuss what the supply and demand indicator is, how it works, and how traders can use it to make informed trading decisions.
What is the Supply and Demand Indicator?
The supply and demand indicator is a trading tool that helps traders identify potential price movements by analyzing the supply and demand levels in the market. This indicator uses horizontal lines to represent areas of support and resistance, which are the levels where buying and selling activity is concentrated.
The supply and demand indicator is based on the principle that when there is more demand for a particular asset than there is supply, the price of that asset will increase. Conversely, when there is more supply than there is demand, the price of that asset will decrease.
How Does the Supply and Demand Indicator Work?
The supply and demand indicator works by identifying areas of support and resistance in the market. These levels are determined by analyzing the price action of an asset over a period of time. When an asset's price reaches a level of support, it is likely that there will be more buyers than sellers, which can lead to an increase in price. Conversely, when an asset's price reaches a level of resistance, it is likely that there will be more sellers than buyers, which can lead to a decrease in price.
The supply and demand indicator uses horizontal lines to represent these levels of support and resistance. The support line is drawn at the lowest point where buying activity is concentrated, while the resistance line is drawn at the highest point where selling activity is concentrated. Traders can use these lines to identify potential entry and exit points for their trades.
How Can Traders Use the Supply and Demand Indicator?
Traders can use the supply and demand indicator to make informed trading decisions by identifying areas of support and resistance in the market. When an asset's price reaches a level of support, traders may consider buying that asset as there is a higher likelihood that the price will increase. Conversely, when an asset's price reaches a level of resistance, traders may consider selling that asset as there is a higher likelihood that the price will decrease.
Traders can also use the supply and demand indicator to identify potential trends in the market. If an asset's price consistently reaches higher levels of support, this may indicate an upward trend in the market. Conversely, if an asset's price consistently reaches lower levels of resistance, this may indicate a downward trend in the market.
Conclusion
The supply and demand indicator is a powerful technical analysis tool that can help traders identify potential price movements in the market. By analyzing areas of support and resistance, traders can make informed trading decisions and identify potential trends in the market. While this indicator should not be used in isolation, it can be a valuable tool for traders who are looking to improve their trading strategies
if you want to learn my number one way to learn supply and demand indicator, click here now
About the Creator
Keep reading
More stories from aamir waqas and writers in Education and other communities.
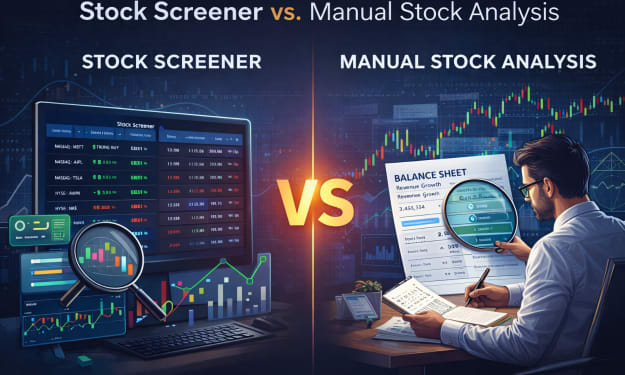
Stock Screener vs Manual Stock Analysis: Which Works Better?
Finding the right stocks in a crowded market is a challenge for every investor. With thousands of publicly traded companies and constant price fluctuations, investors rely on different methods to narrow down opportunities. Two of the most common approaches are using a stock screener and performing manual stock analysis. While both aim to identify profitable investments, they differ significantly in speed, depth, and practicality. Understanding how each method works can help investors choose the right approach—or combination—for their trading and investment goals.
By Alven Smithabout 15 hours ago in Education


Comments
There are no comments for this story
Be the first to respond and start the conversation.