
What Is the Fear Index (VIX) — And How to Use It to Boost Your Returns
The Fear Index

The Fear Index, officially known as the VIX, was created by the Chicago Board Options Exchange (CBOE) to measure expected market volatility over the next 30 days. It’s based on S&P 500 index options and is widely used as a barometer of investor sentiment and market risk.
A higher VIX typically reflects greater expected volatility — often due to fear or uncertainty — while a lower VIX suggests confidence and expectations of a stable market.
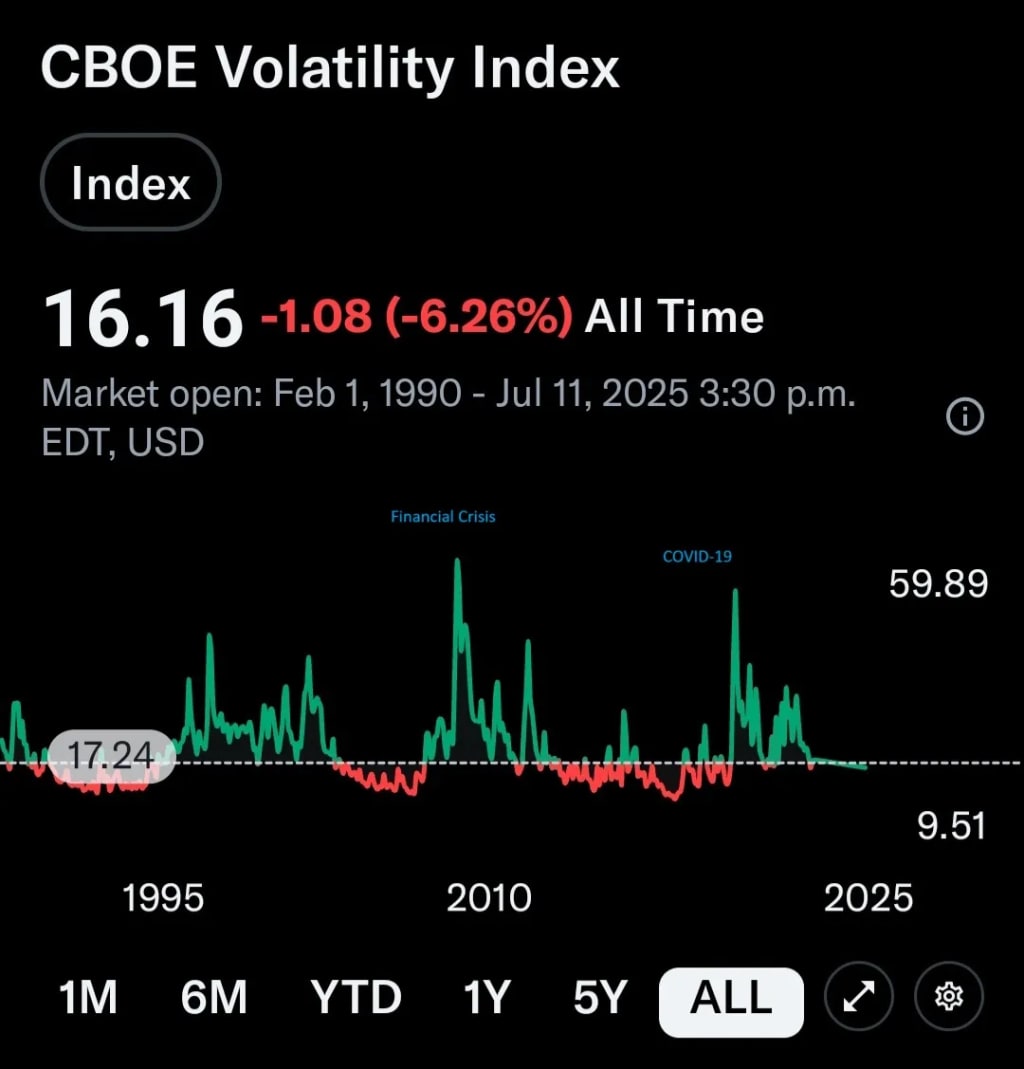
Historically, the VIX has spiked during major crises, including the 2008 financial crisis and the COVID-19 pandemic.
📊 VIX Levels and What They Mean
Below 15: Calm, low volatility expected.
15–20: Normal risk levels
20–30: Moderate fear.
Above 30: High fear and potential panic.
During both the 2008–2009 financial crisis and the COVID-19 pandemic, the VIX surged above 80 — the highest levels since the methodology was updated in 2003 to better reflect S&P 500 option volatility.
As of July 2025, the VIX is around 15, indicating moderate investor concern. This marks a rise of nearly 40% from about 12 a year ago, largely due to concerns about tariffs, rising inflation, and slowing economic growth.
VIX levels from 1990 until today. The graph shows how the VIX spikes during market crises. In particular, the highest two spikes (exceeding 80) occured during the Financial Crisis and COVID-19.
VIX levels from 1990 until today. The graph shows how the VIX spikes during market crises. In particular, the highest two spikes (exceeding 80) occurred during the Financial Crisis and COVID-19 (graph from Yahoo! Finance).
🧮 How the VIX Is Calculated
The VIX is derived from a wide range of S&P 500 call and put options with expirations over the next 30 days.
Call options give investors the right to buy at a set price — the strike price — (benefiting if the market rises).
Put options give the right to sell at a set price (benefiting if the market falls).
The VIX aggregates this data — particularly the strike prices and associated premiums — to estimate how much the S&P 500 is expected to move.
Importantly, the VIX is non-directional: it does not predict whether the market will go up or down, only how much it will move. The farther an option’s strike price is from the current index level (regardless of whether it’s a call or put), the more volatility it implies.
🔄 Real-World Uses and Contrarian Signals
Hedge funds and traders use the VIX to hedge portfolios or trade volatility.
Economists use it to assess systemic risk and investor sentiment.
Retail investors often monitor it as a warning signal.
One of the most practical uses of the VIX is as a contrarian indicator. Historically, when the VIX spikes to extreme levels (above 30), it tends not to stay elevated for long. These spikes are typically short-lived and reflect temporary panic.
As seen during the 2008 crisis, COVID-19, and most recently in April 2025, market bottoms often coincide with peak VIX levels. Investors who were patient — and had the discipline and liquidity to act — were often rewarded.
A useful strategy is to gradually invest more in equities as the VIX rises, assuming you have a portion of your portfolio in liquid or semi-liquid assets (like fixed income) to deploy. For example, in April 2025, the VIX peaked while the S&P 500 was near its bottom — and it has climbed steadily since then.
While no one can predict the future, history suggests that buying during periods of high fear can be a powerful long-term strategy — provided one is prepared for short-term volatility.
S&P 500 (top) and VIX level (bottom) over the past year. The graph shows how the VIX spiked in April as a result of concerns over the Trump tariffs. The peak of the spike corresponds to the S&P bottoming. Subsequently, the VIX quickly subsided as the S&P 500 rose (graph from Yahoo! Finance).
About the Creator
Keep reading
More stories from Maher Quraan, PhD and writers in Trader and other communities.
Irrational Exuberance and Future Returns: What the CAPE Ratio Is Telling Us Now
The phrase "irrational exuberance" was coined by Fed Chair Alan Greenspan in 1996 to describe market prices driven more by investor sentiment than fundamentals. Since then, it has become shorthand for manias and bubbles - famously analyzed by Robert Shiller in his book Irrational Exuberance, which highlights overvalued markets using tools like the CAPE ratio (Cyclically Adjusted P/E).
By Maher Quraan, PhD7 months ago in Trader
Damian Mercer’s Investment Theory and Its Real-World Implementation
Abstract This research report examines the practical application of Damian Mercer’s investment theory, a framework that integrates behavioral finance, risk-adjusted valuation, and adaptive portfolio construction. While Mercer’s theory originated as an academic response to the limitations of classical efficient market assumptions, its true value lies in its applicability to real-world investment decision-making. This paper aims to bridge theory and practice by analyzing the core principles of Mercer’s approach and evaluating how these principles can be implemented across different market conditions, asset classes, and institutional contexts. Through conceptual analysis and illustrative case-based discussion, the report demonstrates that Mercer’s investment theory provides a structured yet flexible methodology for navigating uncertainty, improving long-term returns, and enhancing decision discipline. The findings suggest that, when applied rigorously, Mercer’s framework can serve as a robust guide for both individual and institutional investors.
By Damian Mercer3 days ago in Trader


Comments
There are no comments for this story
Be the first to respond and start the conversation.