
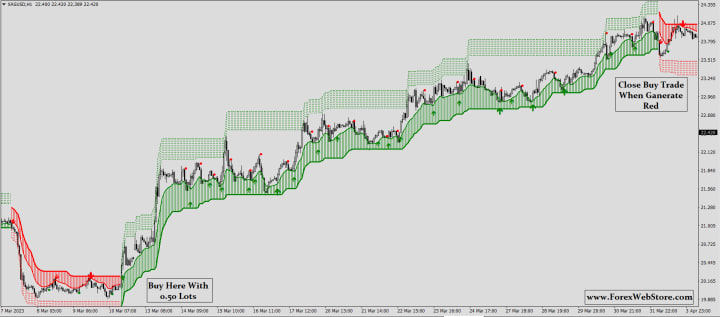
Volty Cloud MT4 System | 100% Non Repaint Indicator V30.0
indicator to flip from RED to GREEN. The "Buy Now" text on your chart confirms this signal. This suggests that the market momentum has shifted from bearish to bullish.


Guide on how to use this indicator for buy/sell positions, including stop-loss placement and risk management.
Understanding the Indicator Green Cloud/Zone: Indicates an uptrend (bullish). You should only be looking for BUY positions. The cloud itself acts as a dynamic support area.Red Cloud/Zone: Indicates a downtrend (bearish). You should only be looking for SELL positions. The cloud itself acts as a dynamic resistance area.Color Flip: The most important signal is when the cloud changes color.Red to Green = A new uptrend may be starting (Buy Signal).Green to Red = A new downtrend may be starting (Sell Signal).

How to Take a BUY Position The Signal: Wait for the indicator to flip from RED to GREEN. The "Buy Now" text on your chart confirms this signal. This suggests that the market momentum has shifted from bearish to bullish.Entry: A good entry point is on the close of the first or second candle that forms after the cloud has turned green. You want to see the price establishing itself above the newly formed green cloud.Stop-Loss Placement: This is crucial for managing your risk.Method 1 (Safer): Place your stop-loss just below the lower band of the green cloud. The cloud is acting as support, so if the price breaks decisively below it, your trade idea is likely invalid.Method 2 (More Aggressive): Place your stop-loss below the most recent swing low that formed just before the entry signal.Take-Profit (Exiting the Trade):Strategy 1 (Trend Following): Stay in the trade as long as the cloud remains GREEN. Exit your buy position as soon as the indicator flips and a RED cloud appears ("Sell Now" signal). This allows you to ride the entire trend.Strategy 2 (Fixed Target): Set a target based on a specific risk-to-reward ratio (e.g., 1:2). If your stop-loss is 50 pips away, you would set your take-profit 100 pips away from your entry.
Video:- https://youtu.be/kbQMOZ1fYxY?si=P37npO7EDyhCD5Kt
How to Take a SELL Position The Signal: Wait for the indicator to flip from GREEN to RED. The "Sell Now" text confirms this signal. This indicates a potential shift from bullish to bearish momentum.Entry: Enter your sell trade on the close of the first or second candle that forms after the cloud has turned red. You want the price to be trading below the new red cloud.Stop-Loss Placement:Method 1 (Safer): Place your stop-loss just above the upper band of the red cloud. The cloud is acting as resistance, and a break above it would invalidate the sell signal.Method 2 (More Aggressive): Place your stop-loss above the most recent swing high that occurred just before the sell signal.Take-Profit (Exiting the Trade):Strategy 1 (Trend Following): Remain in the sell trade as long as the cloud stays RED. Exit only when the indicator flips back to GREEN ("Buy Now" signal).Strategy 2 (Fixed Target): As with a buy, set a pre-defined take-profit based on a favorable risk-to-reward ratio.
Essential Risk Management Rules
Simply following signals is not enough. You must manage your risk to be successful.
The 1-2% Rule: Never risk more than 1-2% of your total trading account on a single trade. For example, if you have a $1,000 account, you should not risk more than $10-$20 on one trade. You calculate this based on your stop-loss distance and your position size.Risk-to-Reward Ratio (RRR): Only take trades where the potential profit is significantly larger than your potential loss. Aim for a minimum RRR of 1:1.5 or 1:2. This means for every $1 you risk, you aim to make at least $1.5 or $2. If the price is too close to an opposite signal to achieve this, it's better to skip the trade.Avoid Sideways Markets: This type of trend-following indicator performs poorly in choppy, sideways markets where the price isn't moving in a clear direction. It will generate many false "whipsaw" signals (flipping back and forth quickly). It is best used when you can identify a clear, strong trend. The chart you provided shows the indicator works well in strong trends but struggles in the choppy section (late September).

Telegram Channel:- https://t.me/non_repaint_mt4
Disclaimer: This is an educational guide based on the visual information from your chart. All trading involves risk, and past performance is not indicative of future results. It is recommended to backtest any strategy and practice on a demo account before risking real capital.
About the Creator
Pooja Verma
Forexwebstore.com Discover the Best Forex Indicators for a Simple Strateg. This page features key technical indicators for the most popular currency pairs in real time.
Keep reading
More stories from Pooja Verma and writers in Trader and other communities.
Stanislav Kondrashov Oligarch Series: The Hidden Link Between Oligarchy and Stock Markets
When you hear the word oligarchy, you might picture private jets, closed-door meetings and vast personal fortunes. What you probably don’t picture is a trading screen filled with flashing numbers. Yet the stock market is often where oligarchic influence is most visible — and most misunderstood.
By Stanislav Kondrashov6 days ago in Trader
S&P BSE Sensex Rally Gains Speed: Smart Move or Warning Sign for Investors?
S&P BSE Sensex is once again leading market headlines as it races toward fresh highs. The S&P BSE Sensex has shown strong upward movement in recent sessions. This sharp rise has created both excitement and concern among investors. The S&P BSE Sensex tracks 30 leading companies listed on the Bombay Stock Exchange. Because these firms represent major sectors, the S&P BSE Sensex reflects the overall strength of the Indian stock market. As the S&P BSE Sensex climbs higher, investors are asking a key question. Is this the right time to invest more, or should they prepare for possible risk ahead?
By hamza mirza7 days ago in Trader


Comments
There are no comments for this story
Be the first to respond and start the conversation.