
The most powerful financial market technical analysis
How to predict prices through powerful technical analysis?


W-bottom Pattem
(1)In this section ,we will analyze the double bottom pattern from aspects such as its definition, formation process, confirmation conditions, market implications, and operation strategies.
(2)predict how high the stock price will rise through powerful technical analysis
1.Formation of the Pattern
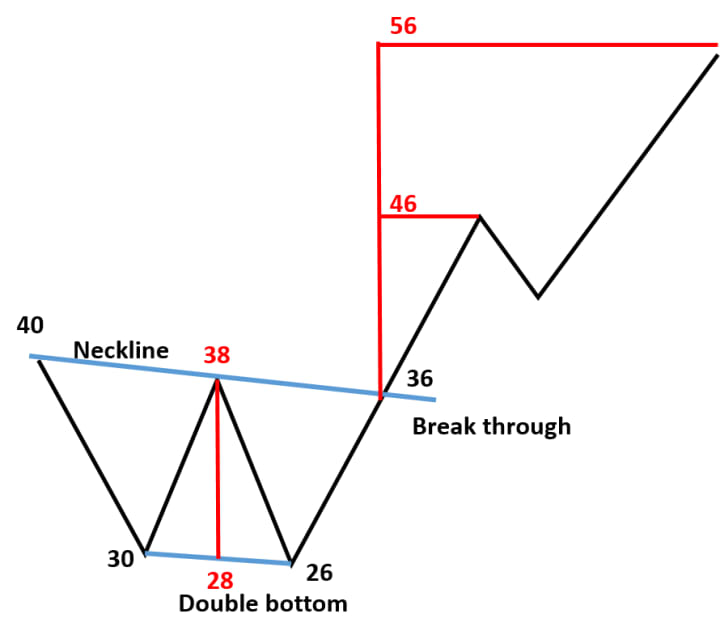
It usually appears as two approximately equal low points on a price chart, connected by a relatively higher rebound high point in the middle. Overall, it resembles the letter "W" in the English alphabet. This indicates that during a price decline, the price has found support at similar levels twice.
2.Formation mechanism
(1)Downtrend stage: The stock price continues to decline due to the dominance of bearish forces in the market and reaches the first low point. This is the first bottom exploration, marking a concentrated release of bearish forces.
(2)Rebound stage: At the first low point, the decline in the stock price attracts some bottom-fishing funds to intervene. Meanwhile, the bearish forces weaken temporarily, leading to a rebound in the stock price.
(3)Second downtrend stage: After rebounding to a certain height, the trapped investors in the market and some profit-taking investors start to sell, causing the stock price to decline again and approach the previous low point.
(4)Second bottom exploration and stabilization stage: When the stock price approaches the previous low point, the buying power strengthens again, preventing the stock price from falling further and forming the second bottom. At this time, the balance of power between bulls and bears in the market begins to change, and the bullish forces gradually gain the upper hand.
(5)Uptrend stage: After the second bottom is formed, the bullish forces continue to exert strength, pushing the stock price up gradually. Eventually, it breaks through the neckline, confirming the formation of the W-bottom pattern.
3.Technical Significance
(1)Trend reversal signal: The appearance of the W-bottom usually indicates the end of the stock price's downtrend and the beginning of an uptrend. It is a relatively reliable bottom reversal pattern. It shows that after the previous decline in the market, the bullish forces gradually accumulate and start to take the dominant position, propelling the stock price into a new upward phase.
(2)Conversion of support and resistance: In the W-bottom pattern, once the stock price breaks through the neckline, the original neckline is transformed from a resistance level into a support level, which provides support for the subsequent rise of the stock price. At the same time, the lows of the two bottoms also become important support areas. Once the stock price retraces to the vicinity of these positions, it often receives strong support.
Trading Strategies
As shown in the figure above, once the 36 neckline level is broken, a W double - bottom pattern is established, and then the price increase can be calculated. Once the technical neckline is broken, the price should not fall below the neckline again. Therefore, when the neckline is broken, go long, and set the stop - loss at the point where the neckline is broken. Conversely, if the neckline holds, look for the price increase target area. This is the way of making large profits and incurring small losses in swing trading, where the potential profit is greater than the stop - loss risk.
Calculation method
How to predict how high the stock price will rise through powerful technical analysis?
(1)The value in the middle of the neckline is approximately 38, and the value in the middle of the double bottom is approximately 28. 38 - 28 = 10.
(2)The position of breaking through the neckline is approximately at 36. 36 + 10 = 46.Usually, when it reaches 46, it will mostly enter consolidation. Then, depending on the situation at that time, if the bullish structure is relatively strong, when it creates a new high in the wave after consolidation, calculate the increase in the second wave.
(3)The increase in the second wave is directly the value 46 in the first wave plus the same distance. 46+10=56.
Case Analysis
In the case analysis, we will use two cases to analyze how to apply the above methods to predict how high the stock price will rise under the W-bottom pattern.
(1) TSLA(2023-2025, weekly Chart)
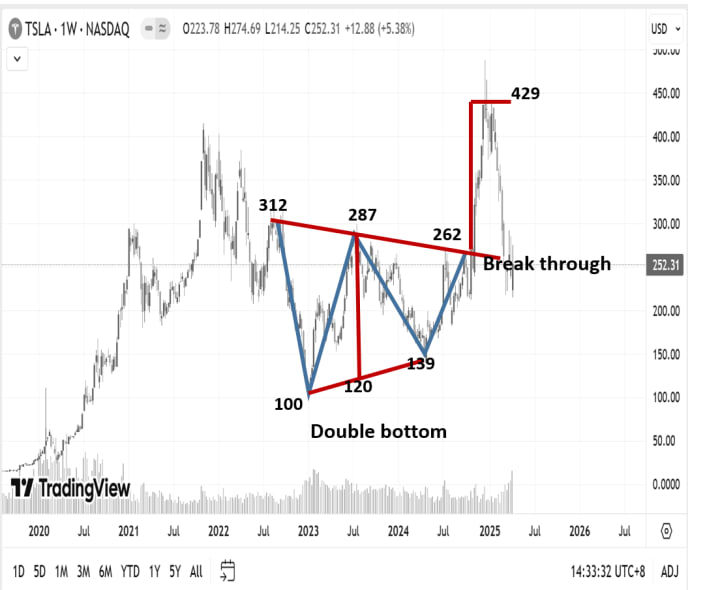
How to predict how high the TSLA stock price will rise through powerful technical analysis?
(1)The value in the middle of the neckline is approximately 287, and the value in the middle of the double bottom is approximately 120. 287-120=167.
(2)The position of breaking through the neckline is approximately at 262. 262 + 167 = 429.Although the share price of Tesla rose to 470 later, we had already made a substantial profit at the target price point of 429.
If you are interested in the content of this e-book, please click on the link below.https://payhip.com/b/LQOyZ
About the Creator
Acne Drugs Market: AI-Driven Innovations Transforming Skincare Treatment
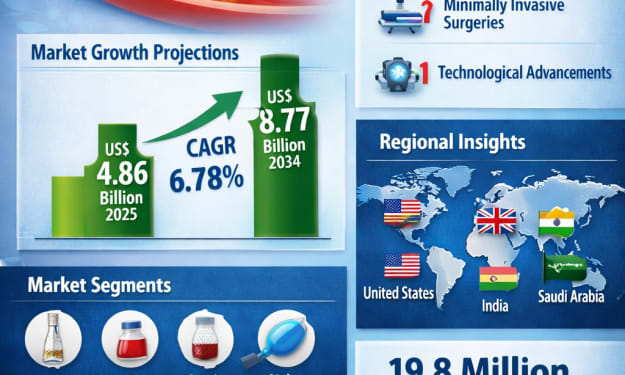
Market Overview Acne vulgaris is one of the most common dermatological conditions worldwide, caused by excess sebum production, bacterial growth, hormonal fluctuations, and inflammation of hair follicles. The Acne Drugs Market encompasses topical therapies, oral medications, combination treatments, and advanced formulations such as retinoids, antibiotics, hormonal therapies, and emerging biologics.
By James Smith7 days ago in Trader
The BAFTA Awards
By now, in a stunning departure from recent years, most of the world is aware of what happened at the BAFTA film awards. Social Media Headlines will tell you the bare bones: that John Davidson, a Tourette's Syndrome advocate, shouted a racial slur at two Actors of Colour, Michael B Jordan and Delroy Lindo.
By Natasja Rose6 days ago in Psyche


Comments
There are no comments for this story
Be the first to respond and start the conversation.