
How to tell if an indicator repaints?
Exploring non-repainting alternatives is an essential strategy for traders who prioritize accuracy and reliability in their technical analysis.

When an indicator repaints, its value changes several times before the bar finishes because it recalculates its values while the current bar is still creating. Traders can utilize live testing or TradingView's "bar replay" tool to identify repainting.
You can update your script to avoid using values that change while the real-time bar is displayed in order to avoid repainting. Alternatively, you can utilize the open price, which is not updated in real time, or information from a bar that has previously passed.
Common Causes of Repainting in Indicators
The most common factors are:
Use of security() function in Pine Script
Calculations on Heikin-Ashi candles
Real-time bar recalculations
Repainting the latest candle
The primary cause of repainting in TradingView indicators can be attributed to the variations in data computation and presentation methodologies between historical and real-time chart views. Using the security() function in Pine Script is a common reason for repainting. This feature is used to combine data from several time periods into a single script. In the event that an indicator retrieves the closing price for a higher time frame using security() for computations in a lower time frame, for example, the values of the indicator in the lower time frame may fluctuate until the higher time frame bar closes. Repainting occurs from the indicator's historical values being continuously updated on the chart as new data becomes available, thereby deceiving traders about the indicator's historical accuracy and dependability.
Another major contributor to repainting is the use of indicators on Heikin-Ashi candles, as well as computations based on real-time bar data. Heikin-Ashi candles are intended to smooth out price swings by changing normal price data, making it easier to visualize trends. However, this smoothing might compromise the accuracy of real-time price information, when leading indicators are applied to these candles to update previous values with new data. Indicators that calculate values based on the open, high, low, and close of real-time bars confront a similar difficulty; these values are uncertain and vary until the bar formally closes. This might result in transitory and sometimes deceptive numbers in the indicators, which traders may incorrectly interpret as stable historical data.
Effects of Repainting on Trading Decisions
Repainting in trading indicators can have a substantial negative impact on trading decisions, principally because it gives a false impression of an indicator's trustworthiness and effectiveness in historical research. Traders that rely on these indicators for entry and exit choices may perceive flawless signals on a historical chart, which appear to foretell market movements with high accuracy. However, as fresh data becomes available, these signals may fluctuate or disappear, resulting in potentially disastrous trading decisions based on erroneous information. This disparity between historical and real-time data can lead traders to misunderstand the strength and direction of market movements, resulting in misguided confidence in their trading strategies' predictive ability.
Furthermore, the consequences of repainting can be seen in automated trading systems, as computers respond to signals given by these indicators. If a trading technique is backtested using repainted data, it is likely to produce exceptionally favorable results that cannot be replicated in live trading. This might result in a strategy being over-optimized for specific historical conditions that do not adequately represent future market behavior, creating false expectations about the system's performance. For traders, this frequently results in greater risk exposure and potential financial losses because the system fails to adjust to or accurately predict real market developments.
Techniques to Detect Repainting in Scripts
To properly detect repainting in trading scripts, it is necessary to understand and recognize the four major types of repainting behavior. Here's how each type can be examined:
Recalculation During the Real-Time Bar
This sort of repainting occurs when an indicator recalculates its values while the current bar is still forming, allowing the indicator's value to change several times before the bar finishes. Traders can discover this through live testing or the "bar replay" feature on systems such as TradingView. This allows us to see how indicator values change in real time. If values remain unstable during the development of the bar and only settle once it closes, this implies recalculation repainting, which can lead to incorrect real-time decision-making.
Misleading Plotting in the Past
Indicators that repaint by showing previous data differently when new data enters might drastically alter a trader's view of market circumstances. To discover this, traders should review the historical data on a chart after refreshing or reloading the website. If historical indicator values alter after a refresh, this is a clear indication of misleading plotting. This technique aids in determining whether previous signals that appeared solid are actually incorrect when new price data is reviewed.
Unacceptable Use of Future Information
Some scripts seek to improve accuracy by adding future data into current computations, which is considered a dishonest trading tactic. Reviewing the Pine Script code for functions such as security() is critical here. The script should be reviewed to ensure that it does not include future data that will only be available after the current bar has closed. Proper coding should ensure that the data used to generate signals strictly correlates to the information that was previously available at that time, without anticipating or presuming future situations.
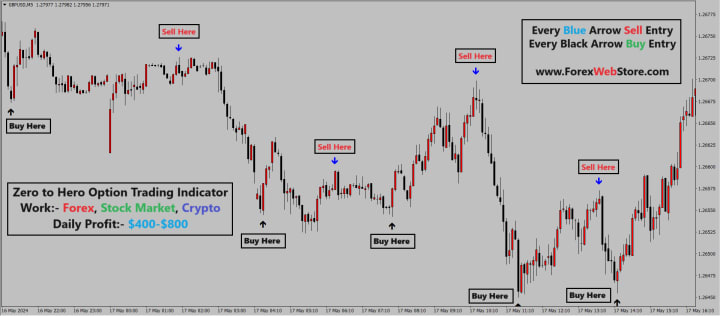
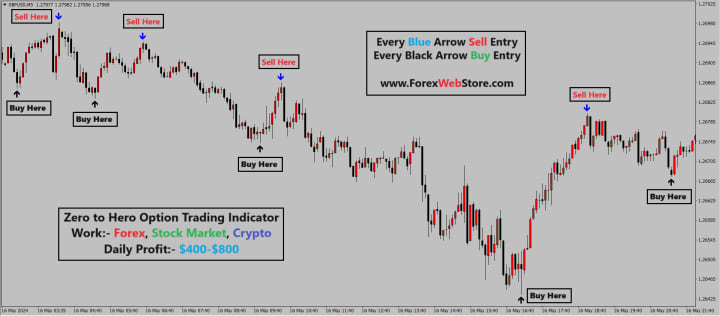
Download Here:- Zero to Hero Option Trading Indicator
About the Creator
Pooja Verma
Forexwebstore.com Discover the Best Forex Indicators for a Simple Strateg. This page features key technical indicators for the most popular currency pairs in real time.
Keep reading
More stories from Pooja Verma and writers in Trader and other communities.
Bayer Share Price Trends: Is Now the Right Time to Invest?
The bayer share price has been moving in ways that are attracting attention from investors. Many are asking whether now is the right time to buy, or if caution is better. Watching the bayer share price trends closely can help investors make smarter choices. They look at the bayer share price trends in simple, clear language. We explore both opportunities and risks so readers can understand the full picture before making decisions.
By John.doe7985 days ago in Trader
The BAFTA Awards
By now, in a stunning departure from recent years, most of the world is aware of what happened at the BAFTA film awards. Social Media Headlines will tell you the bare bones: that John Davidson, a Tourette's Syndrome advocate, shouted a racial slur at two Actors of Colour, Michael B Jordan and Delroy Lindo.
By Natasja Rose4 days ago in Psyche


Comments
There are no comments for this story
Be the first to respond and start the conversation.