
How simple is the ma cross indicator?
The ma cross indicator from Tradingview is one of the most simple trend forecasts on the market. We will explain down below why is that so.

We from Academy4Cryptoverse are a big community who in crypto mostly over 10 years. For many of us is just a sidehustle or a hobby. However many of us have no choice during covic virus and during recession and make trading to there main income
However because we are a community we despise scamers that try to leech out our money for education in trading, or selling Signals.Thats why we creating a source of knowledge you can not find anywhere else.
Mostly recommend trading indicators, Books about cryptocurency investment trading staking and online exchanges. Also candle patterns like Elliotwave, support and residence, bullish signs and bearish signs
The ma cross indicator from Tradingview is one of the most simple trend forecasts on the market. It is usually a must to have in your trading analyse. We like it specially because is clear and you still can see the candle patterns. Also is very frindly with another trading indicator combinations. We will explain in detail why we reommend the ma cross indicator with another combinations with our own pictures
A moving average crossover occurs when two or more moving averages cross paths, confirming a shift in the market trend. This going to happen when large shifts in price action become manifest, pushing the lines up or down and, helping to find out, causing them to cross.
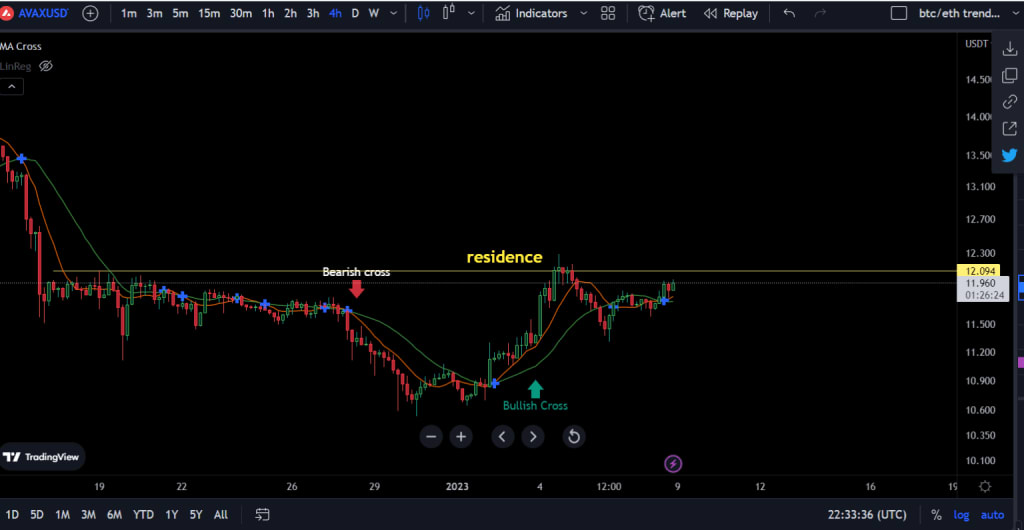
You can see these events in action through the image below where we ad also residence in price:

Transparent to see the both cross overs. We have on the end another bullish crossover but we have big longterm residence around 12.004. That means it will get possibly rejected.
When the shorter-term MA crosses above the longer-term MA, it’s a buy signal, as it indicates that the trend is shifting up. This is known as a golden cross. Meanwhile, when the shorter-term MA crosses below the longer-term MA, it’s a sell signal, as it indicates that the trend is shifting down.
Exponential Moving Averages (MA) help identify 1) price trends and 2) potential support and resistance levels.
EMA crossover in trading occurs when a short-term EMA (e.g. 12 day) crosses the long-term EMA (e.g. 50 day), either above (bullish, uptrend) or below (bearish, downtrend).
As you guys see on picture below adding the Indicator Echo and Volume in the 4 hour chart . Also in the next pic the Lin Reg indicator. Both of these indicators are explained in our Site and helped me to find out if the cross will be sucessfull and might a breakout.

Here above we using together with the Echo indicator and Volume . Thats a good combo when are you experienced to read candles and can forecast the next price move. We will soon piplish here the Wcho Indicator, but in the meantime you can check it out in our website.

And here we using it together with our LinReg indicator.
And there you can actually see that there will be soon a new cross down or to be more precisly there is a high change to get rejected. But this prediction comes just with lots of experience.(Support and Residence ) Also this LineReg indicator we will present later or you can check it out now in our website.
I hope this article show you the mindset we trying to share. There is so much more we like to write about.
It would help us a lot to reach out to more people and would be great to visit us, write a comment or follow us on Twitter, Pinterest and facebook.
About the Creator
Logan
The most resourceful free information about cryptocurrencies.We all about knowledge and education.
alex honnold net worth: How Fearless Climbing Turned Passion into Lasting Wealth
alex honnold net worth is the result of a rare mindset and years of brave choices. Alex Honnold became famous for climbing huge rock walls without ropes. This risky path was not about money at first. It was about focus, control, and love for climbing. Over time, his bold actions brought global attention. That attention helped turn passion into income. Today, alex honnold net worth reflects both courage and smart decisions.
By John.doe798about an hour ago in Trader
Autonomy Is The Real Privilege
Good morning, freedom-seekers! Today we’re gonna be looking at autonomy. A strange word, I know; one many would probably look at blankly and run away from on sight. We’re gonna figure out what it actually means, consider how it’s achieved, and decipher just how deeply most of us are tangled up in dependence without realising it.
By That ‘Freedom’ Guy6 days ago in Humans


Comments
There are no comments for this story
Be the first to respond and start the conversation.