
Build a Stock Screening Dashboard with Streamlit
Streamlit is a powerful library that can be used to improve your ability to screen stocks.
In my pursuit of researching companies for my own personal portfolio, I ended up needing a way to quickly look at a company and make a decision about its long term prospects. I started with something very clunky in Excel, but I quickly pivoted to something more elegant in Python.
Streamlit is a really powerful Python library, typically used for visualizing machine learning projects through a web interface. I fell in love with it for its ease and speed in pulling together a dashboard. I was able to do this project in less than 200 lines of code. The other thing I really liked about Streamlit was that it has lots of different options for doing plots, which is nice if you want make the outputs more "you". I personally went with Plotly because I find their plots aesthetically pleasing. I also utilized the dark mode and set the display to wide in order to utilize more of the display window. The code for the dashboard can be found on GitHub in case you want to use it as the basis for your own dashboard.
Implementation:
The first thing I did was grab some financial data. I used Yahoo Finance's API to pull stock prices and took the financial data from SimFin. SimFin is slick, because it offers all but the last years balance and income statements in a convenient .csv format. This saved me a lot of time by not having to do web scraping and gave me a lot of data to work with. In the future I am going to try and create a function to continuously update the data so that the display is live. I also imported some other standard libraries (time, pandas, numpy, and pickle for my ML model):
Next, I needed a way to select the company to display. I added a select box and set it up to have a drop down with all the company names. I also drew up a layout with my ad hoc Excel document, and realized it would be helpful to use the beta_columns feature for side-by-side plots.
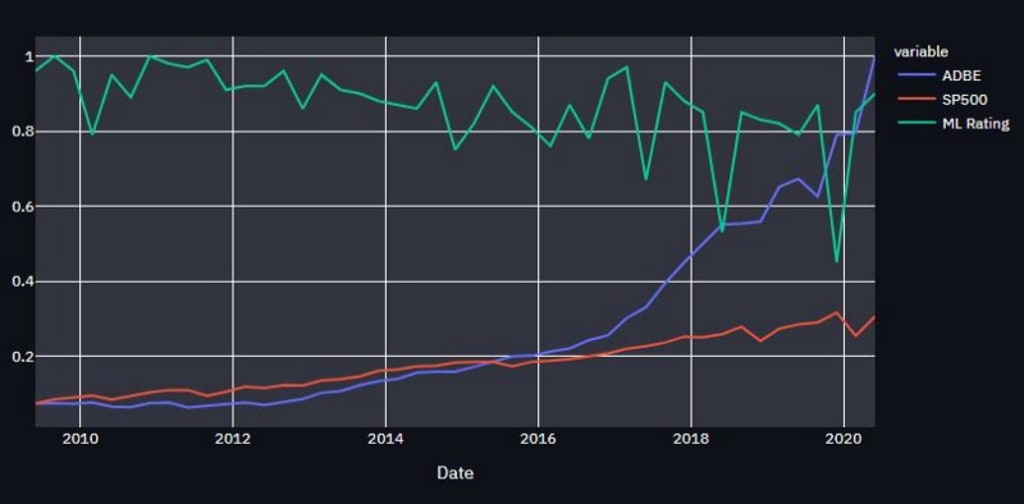
The first plot compares the stock price vs. the S&P 500 over the duration of the company. The S&P 500 data is pulled using Yahoo Finance. I added QTR and Years to the dates associated with the S&P 500, as this made it easier to line the data up with the quarterly reports.
I also added my ML model output. It is a random forest that looks at the fundamental data. Classes are assigned by comparing against the S&P 500 index. Further details on the ML model are not covered here, but I plan to do this in a future article. For now I just load it with pickle.
The second plot takes a look at treasury shares and R&D over time. I found this to be helpful in understanding what a company does with the money it makes. The code below constructs the plots.
For the last major piece, I wanted a way to quickly look at the fundamental data and understand how the company is doing. One thing I had done in my Excel workbooks was conditional formatting. Luckily, Pandas Stylers gives us an easy way to do this on a column-by-column basis. The criteria for the formatting isn't given here, but in the future I will be creating an article walking through this in more detail.

I ended up making a function for each format rule that should be applied to a column. There is probably a more elegant way to do this, but the goal was speed and a clean-looking output. Below is an example format function:
def Debt_format(x):
if(x>=1):
y= 'background-color: red'
else:
y=' '
return y

The last touch I added was a radio button to go between displaying the filtered data or complete data from the balance and income sheets. This was useful if I wanted to take a deep dive into a particular company.

This article highlights some of the useful things you can do in Streamlit and how it can help you create a stock screening dashboard. It has a way to select the company you want to look at, multiple plots, and a table with highlighted values to indicate how the company is doing. Here's a GIF of my dashboard in action.
The code for the dashboard can be found on GitHub, but I didn't include the data I downloaded from SimFin in order to not violate the user agreement. I hope you walk away from this article with a better understanding of Streamlit and some inspiration to create dashboards of your own.
About the Creator
Keep reading
More stories from Carl Westerby and writers in Trader and other communities.
How to Do Deep Dive Stock Analysis
The 2008 Crash, Volatility, and Correlation Analysis In a previous article, I made stock selections using fundamental analysis (“Warren Buffett style”) and combined it with some machine learning. I back-tested the model through the previous 10 years and it performed well (21.6% growth). After reading the article, a good friend asked some great questions. This article will take a look at some of those questions in detail.
By Carl Westerby4 years ago in Trader
PC Jeweller Share Price Analysis 2026: Stocks, Gains, and Volatility Guide
The stock market can be confusing, especially for investors looking to track specific companies like PC Jeweller. If you are searching for pc jeweller share price today, this guide will give you a clear understanding of its market trends, performance, and factors affecting its share value.
By Safdar meyka6 days ago in Trader
A Dart at Dusk
Seconds ago, the sullen sun set on the two of us… my exuberant furry companion and me. A fresh breeze embraces us, delivering welcome relief from the day’s oppressive heat. His typical stumbling and staggering along — apace with a sloth — has turned into trip-trapping, high-stepping, almost skipping along.
By Angie the Archivist 📚🪶a day ago in Petlife


Comments
There are no comments for this story
Be the first to respond and start the conversation.