
Beat the S&P 500 with Machine Learning
Use fundamental analysis as feature input for an ML model to pick stocks.

The S&P 500 acts as a great benchmark for investment gains. Lots of investors try to beat it and fail miserably. The idea that I want to walk through in this article is: could you beat the S&P 500 by only picking the best stocks within it? No offense to companies like GE and GM, but if you dropped them from the S&P 500, the index’s overall performance would improve.
The natural question is how to determine which stocks are best? The approach I took was to compare the performance of individual companies against the S&P 500. I did this on a quarter-by-quarter basis as well as comparing total returns over the period where I had financial statements for the company.
The next question is how do you create feature input for your machine learning model? For this I decided to take a page out of Warren Buffet’s book and use fundamental analysis as the basis for feature design. The thinking here is that by feeding in the same inputs that one of the greatest investors in modern time has used, we can try to replicate his results.
Data Preprocessing:
I wrote a previous article that details the things that Warren looks at in a company’s financials and the reasoning behind them:
In addition to the variables mentioned here, I included some other relevant information like RIO, stock quarter percent growth, and a few other metrics that were on hand or easy to calculate.
A lot of the balance sheet and income statement information I used to setup my model comes from SimFin. Because I used the free version, my input is missing the last year’s worth of financial data. I pulled stock price using Yahoo finance’s API. I was able to add a quarter and year tag to both the balance sheet info and income statements. I then used pandas to stitch the two files together. The end result was that each company gets a row in the data frame for each quarter that they had financial statements. I previously wrote an article that dives into the details in depth.
For creating the output labels I compared the returns each quarter against the S&P 500 and gave them 1 if the company beat the S&P 500 and a 0 if they did not.
Initial Model Creation:
My starting point here was to use a random forest for the ML algorithm. I went this direction because this type of model does not typically tend to overfit the data given how the training data is sampled between the different trees in the forest. A random forest also doesn’t require as much parameter tuning as other models to achieve reasonable performance. I did a random train test split and used the comparison against the S&P 500 as the output label.
Unfortunately, the output doesn’t look very different than flipping a coin.
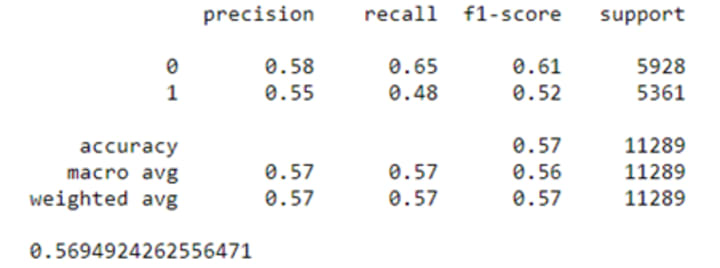
Let’s see if we can rethink the setup and improve the performance.
Tweaked Output and Updated Model:
I went back through the data and challenged some of my assumptions. The output comparison against the S&P 500 was pretty noisy. Since we are taking the Warren Buffet approach, what we actually want the ML model to do is identify a company with long term potential. So, I switched up the output label to be a 1 for all quarters if the company had a higher average rate of return than the S&P 500, and a 0 if it did not. The consequence of this is that each company’s entries are either all 1’s or all 0’s. This better fits our premise of picking good companies, rather than picking quarters in which companies will be good.
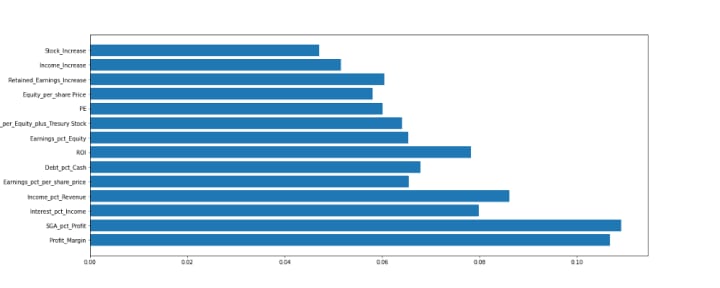
With the changes discussed above accuracy jumps up above 80%, which is much better than the coin flip we had previously.

The feature importance shows that there isn’t a single feature that stands out above the others. Profit Margin and SG&A % of Profit end up being the most important, but not overwhelmingly so.
Example Historical Analysis:
In the last section we came up with an ML model to help us rate stocks that had a reasonable prediction accuracy. How would the stocks recommended by this model actually perform? To figure out if this approach would work, I went back and dropped all data after 2011. I reran the ML model training and made some selections of stocks that came highly recommended by the model. I also tried to pick stocks from different sectors to give some diversification to the portfolio. I then “bought” $1,000 worth of each stock and compared how a comparable amount of money would have done against an equal amount of money in the S&P 500. I also tried to avoid stocks that I knew had massive returns (like Apple and Google), even if the model recommended them. The composite results earned a compound annual growth rate (CAGR) of 21.6% compare to the 14.5% for the S&P 500. The results over the 10 year period are almost double that of the S&P 500.

Not all of the stocks out-performed the S&P 500 but most of them did. The ones that didn’t perform as well still made money and were pretty close to the S&P 500. The ones that outperformed, did so by a much wider margin than the ones that underperformed.

Hopefully by the end of this article you were exposed to a new way of thinking about stock selection and saw a unique approach to using machine learning to help with stock analysis. In the future, I plan to run more back testing to help validate the benefit of the model.
Note that this article does not provide personal investment advice and I am not a qualified licensed investment advisor. All information found here is for entertainment or educational purposes only and should not be construed as personal investment advice.
About the Creator
Keep reading
More stories from Carl Westerby and writers in Trader and other communities.
How to Invest Like Warren Buffett
Photo by Lukas Blazek on Unsplash Introduction The Oracle of Omaha is famous for being a fundamental investor. One area where he differs from traditional Graham value investors is that he is in a company for the long haul (>10 years).
By Carl Westerby4 years ago in Trader
Philippines Travel Technology Market: Digital Transformation, Consumer Trends & Industry Growth
Philippines Travel Technology Market Overview The Philippines travel technology market is expanding rapidly as travel operators, service providers and consumers increasingly adopt digital solutions to enhance convenience, efficiency and overall travel experiences. Travel technology — encompassing online booking systems, mobile applications, artificial intelligence (AI), cloud platforms, data analytics, digital payments and customer engagement tools — has become a strategic cornerstone for airlines, hotels, tour operators, travel agencies and transport services. The Philippines travel technology market size reached USD 214.00 Million in 2024. Looking forward, the market is expected to reach USD 361.86 Million by 2033, exhibiting a growth rate (CAGR) of 6.01% during 2025-2033. This growth reflects rising internet penetration, mobile usage, digital payment adoption and a resurgent travel demand post-pandemic as Filipinos and international tourists seek seamless digital journeys.
By Manisha Dixit3 days ago in Trader
The Ultimate Guide to the Fear and Greed Index
Markets aren’t purely logical — they’re driven by fear, greed, confidence, panic, and complacency. These psychological forces affect trends, volatility, breakouts, crashes, and bubbles. The Fear and Greed Index helps you quantify that emotional pressure.
By Beirman Capital7 days ago in Trader


Comments
There are no comments for this story
Be the first to respond and start the conversation.