
Trading is the practice of buying and selling financial instruments such as stocks, bonds, commodities, and currencies with the aim of making a profit. The basic concept of trading is simple: buy low and sell high. However, the execution of this concept can be complex and requires a good understanding of market dynamics and analysis.
To start trading, you need to open a trading account with a broker. Once you have funded your account, you can start buying and selling financial instruments. It's important to have a trading plan in place, which outlines your goals, risk tolerance, and strategies.
There are two basic types of trading: long-term investing and short-term trading. Long-term investing involves holding onto assets for a significant period, typically years, and aims to achieve capital appreciation over time. Short-term trading, on the other hand, involves buying and selling assets in a short time frame, typically hours or days, with the aim of making quick profits.
One of the key factors that affect trading is market volatility. Volatility refers to the degree of price variation of an asset over time. Highly volatile markets are riskier but can offer higher potential returns, while low-volatility markets are generally safer but offer lower returns.
To make informed trading decisions, it's essential to conduct market analysis. This involves studying past and current market data and trends to predict future market movements. There are two main types of market analysis: fundamental analysis and technical analysis.
Fundamental analysis involves examining the underlying economic and financial factors that affect the value of an asset, such as company earnings, economic indicators, and geopolitical events. Technical analysis, on the other hand, involves analyzing charts and other technical indicators to identify patterns and trends in price movements.
Trading strategies vary depending on the trader's goals, risk tolerance, and market conditions. Some common trading strategies include trend-following, momentum trading, value investing, and contrarian investing.
Risk management is a crucial aspect of trading. It involves identifying and minimizing potential losses. One popular risk management technique is the use of stop-loss orders, which automatically sell an asset when it reaches a predetermined price level to limit potential losses.
In conclusion, trading can be a profitable but complex activity that requires a good understanding of market dynamics, analysis, and risk management. It's important to have a trading plan in place and to conduct thorough market analysis before making any trading decisions. With the right knowledge and strategies, anyone can become a successful trade
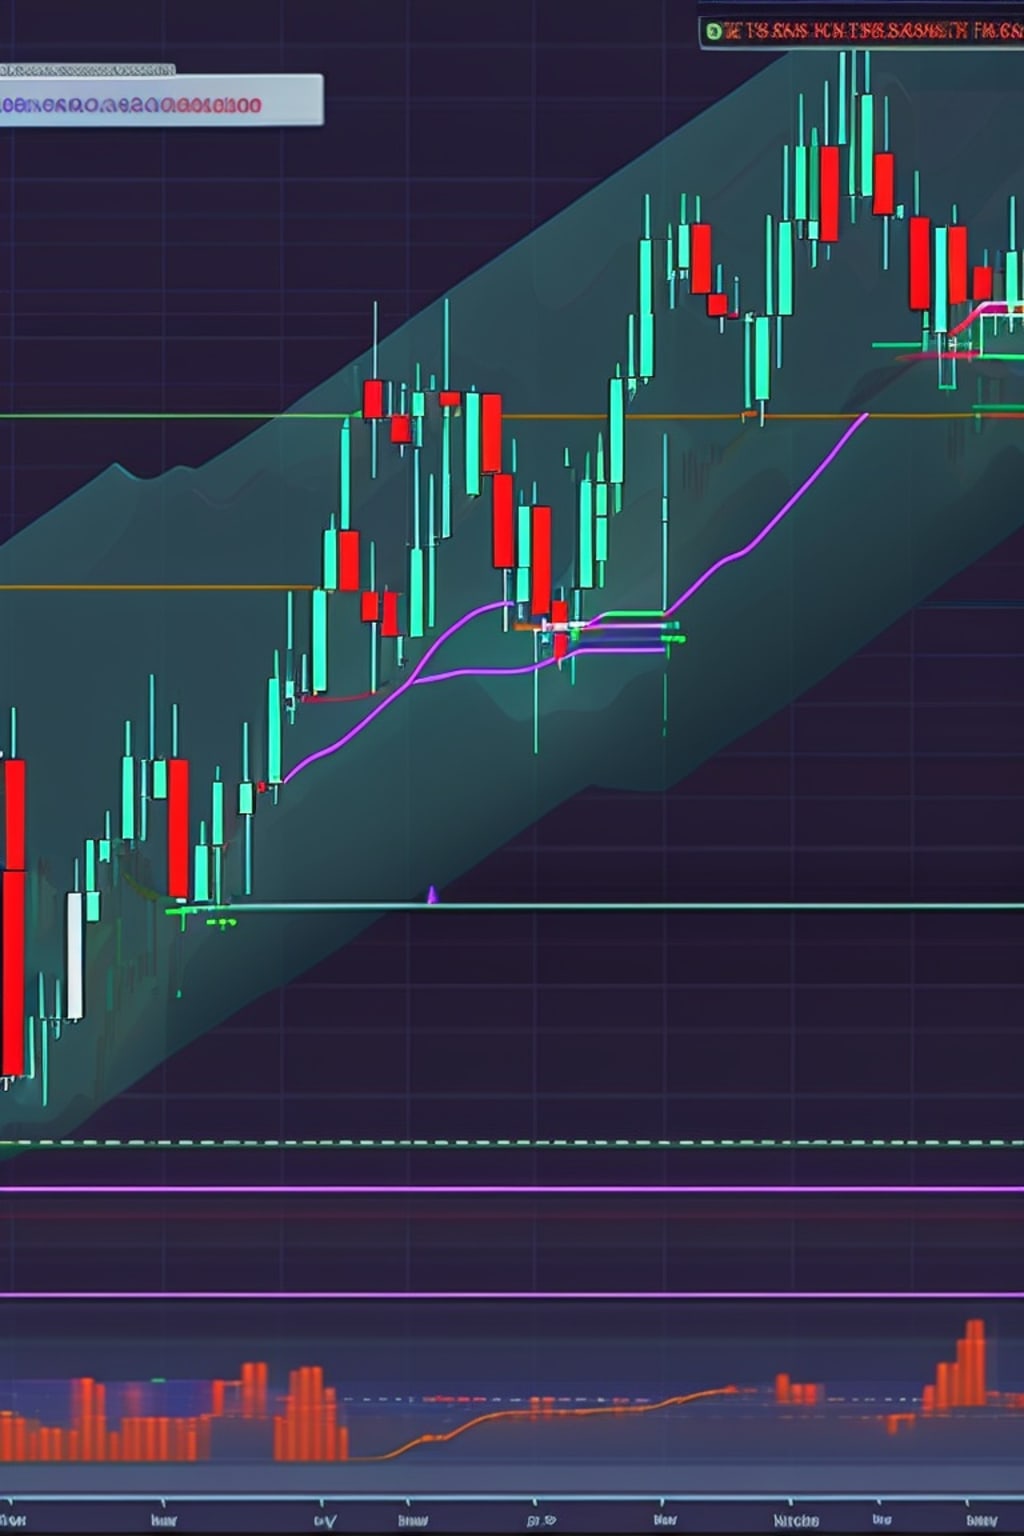
Support and resistance levels are key concepts in technical analysis and trading. They are used to identify levels in the price of an asset where buyers and sellers tend to enter or exit the market, which can provide traders with potential buy and sell signals.
Support is a price level where there is buying pressure in the market, which prevents the price from falling further. In other words, it is a price level where buyers are willing to enter the market and buy an asset, which creates demand and supports the price. Support levels are usually identified by analyzing past price data and looking for areas where the price has previously bounced back from.
Resistance, on the other hand, is a price level where there is selling pressure in the market, which prevents the price from rising further. In other words, it is a price level where sellers are willing to enter the market and sell an asset, which creates supply and resists the price. Resistance levels are also identified by analyzing past price data and looking for areas where the price has previously struggled to move beyond.
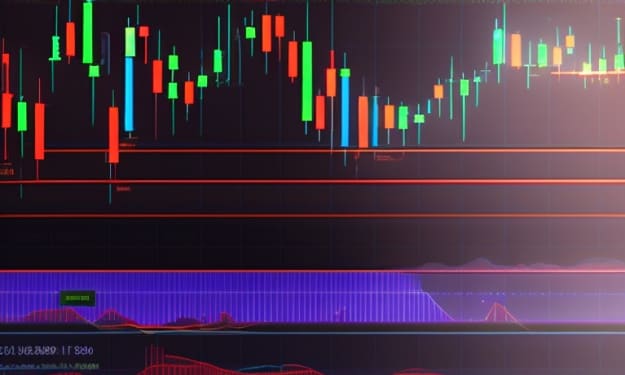
When an asset's price approaches a support or resistance level, it can create potential trading opportunities. For example, if the price of an asset is approaching a support level, traders may look for potential buying opportunities, expecting the price to bounce back up from the support level. Conversely, if the price is approaching a resistance level, traders may look for potential selling opportunities, expecting the price to struggle to move beyond the resistance level.
Traders can use different technical indicators and tools to identify support and resistance levels, such as trend lines, moving averages, and pivot points. It's important to note that support and resistance levels are not exact, and the price of an asset can break through these levels if there is enough buying or selling pressure in the market.
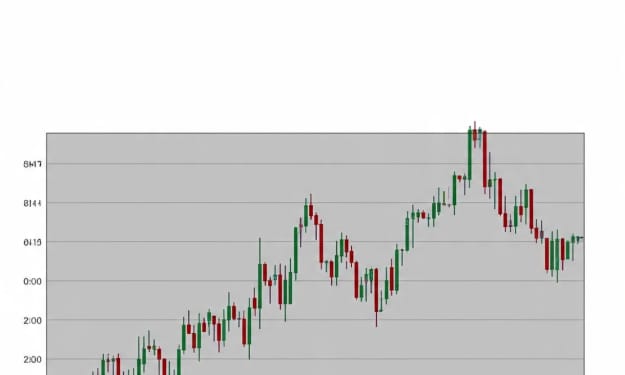
In summary, support and resistance levels are key concepts in technical analysis and trading. They are used to identify levels in the price of an asset where buyers and sellers tend to enter or exit the market, which can provide traders with potential buy and sell signals. Traders can use different technical indicators and tools to identify support and resistance levels, and it's important to remember that these levels are not exact and can be broken if there is enough buying or selling pressure in the market.
About the Creator
Australia Organic and Natural Pet Food Market Set to Nearly Double to USD 1,150.44 Million by 2033
The Australia organic and natural pet food market is experiencing robust expansion as pet owners increasingly prioritise health, wellness and ethical sourcing for their animals’ diets. According to the latest IMARC Group report, the market was valued at USD 628.40 million in 2024 and is projected to reach USD 1,150.44 million by 2033, exhibiting a compound annual growth rate (CAGR) of 6.95% during 2025–2033. This growth reflects a combination of cultural shifts in pet ownership, greater awareness of nutrition’s impact on pet health, and broader consumer demand for premium, clean-label pet food offerings.
By Rashi Sharma5 days ago in Trader
lmt stock poised for growth: unexpected trends, steady demand, and investor insights
lmt stock is attracting attention as investors notice unexpected trends and steady demand. Unlike volatile stocks, lmt stock moves with purpose, showing resilience and opportunity. In this article, we explore why lmt stock continues to capture interest, what drives its performance, and how it can fit into your long-term investment strategy.
By John.doe7986 days ago in Trader
📢 Raise Your Voice Thread: 01/22/2026
Our “Raise Your Voice Threads” are hosted most alternating Thursdays at 12PM ET to offer creators more avenues to uncover exceptional stories on Vocal. As we are continuously searching for fresh creators and inspiring stories, this thread provides an opportunity to exchange and discuss the stories that have moved and motivated us on Vocal.
By Raise Your Voice by Vocal5 days ago in Resources


Comments
There are no comments for this story
Be the first to respond and start the conversation.