
The Map, the Myth, and the Math: What Texas’s New District Plan Really Shows
Unspoken thoughts on Texas Redistricting Proposal PLANC2308 – July 2025 Prepared using publicly available data from the Texas Legislative Council (PLANC2308 District Population Analysis, July 29, 2025) and U.S. Census Bureau ACS 2019–2023 Citizen Voting Age Population (CVAP) Special Tabulation for Texas

When the public hears racial inequality claims in politics, like Texas Rep. Vince Perez (D, El Paso, District 77) saying “Latino citizens count for one-third, Black citizens for one-fifth, of a white resident,” the words sound urgent and even righteous. But rhetoric without precision is not public service; it is stagecraft. When numbers are presented without the actual mechanics of representation, they do not enlighten anyone. They construct a narrative.
The problem is that legislative power in a democracy is tied not to residents, but to eligible voters. If you compare the wrong groups, for example eligible minority voters to the total white resident population, you are not describing the electoral reality. You are telling a half-truth dressed as moral outrage.
The Numbers That Actually Matter
Using Texas’s own redistricting data and U.S. Census Bureau estimates, we looked at three different measures of population:
•Total Population (Residents): Everyone counted in the Census, regardless of age or citizenship
•Voting-Age Population (VAP): Adults 18 and older, regardless of citizenship
•Citizen Voting-Age Population (CVAP): Adults 18 and older who are U.S. citizens and therefore eligible to vote
The differences are not small:
•Total Population (Residents): Hispanics ~41%, Whites ~40%, Blacks ~12%
•Voting-Age Population (Adults): Hispanics ~35%, Whites ~44%, Blacks ~12%
•Eligible Voters (CVAP): Hispanics ~32%, Whites ~53%, Blacks ~14%
This CVAP gap is decisive. While Hispanics are the largest share of Texas residents, their share of eligible voters is significantly smaller because of citizenship rates and age distribution. White Texans, conversely, make up a smaller share of the population but a majority of eligible voters. Black Texans shift less, but still differ between total and eligible population.
If you ignore these differences, you might conclude that the maps undervalue certain groups. In reality the voting-eligible breakdown is not the same as the raw resident breakdown.
Why This Matters to You
Whether you are Republican, Democrat, or politically independent, the way you are represented starts here. District lines are legally drawn to balance total population, but the political influence within those districts depends on who can actually vote.
If you care about fair elections, you cannot measure voting power by counting people who cannot legally cast a ballot. Doing so is not just sloppy, it is misleading. And misleading data fuels bad policy, misplaced outrage, and deeper political division.
The Lens of Human Insight
Philosopher Bernard Lonergan described knowing as a process: experience, understanding, judgment, and decision. First, you take in the facts. Then you ask the right questions. Then you weigh the evidence and decide what is true. Finally, you act.
Applied here, Lonergan’s Generalized Empirical Method means holding claims to the right standard. Measure eligible voters against eligible voters, not residents against voters, and judge the statement by that reality. Yet too often, public debate on redistricting stops at the first stage, the raw experience of hearing a demographic number. People hear someone like Texas Rep. Vince Perez deliver a racially framed statistic, nod along as if every word is unquestionable truth, and shake their heads at all the right beats. It becomes a political call-and-response. Agreement by reflex is not understanding, and understanding without judgment is not civic responsibility.
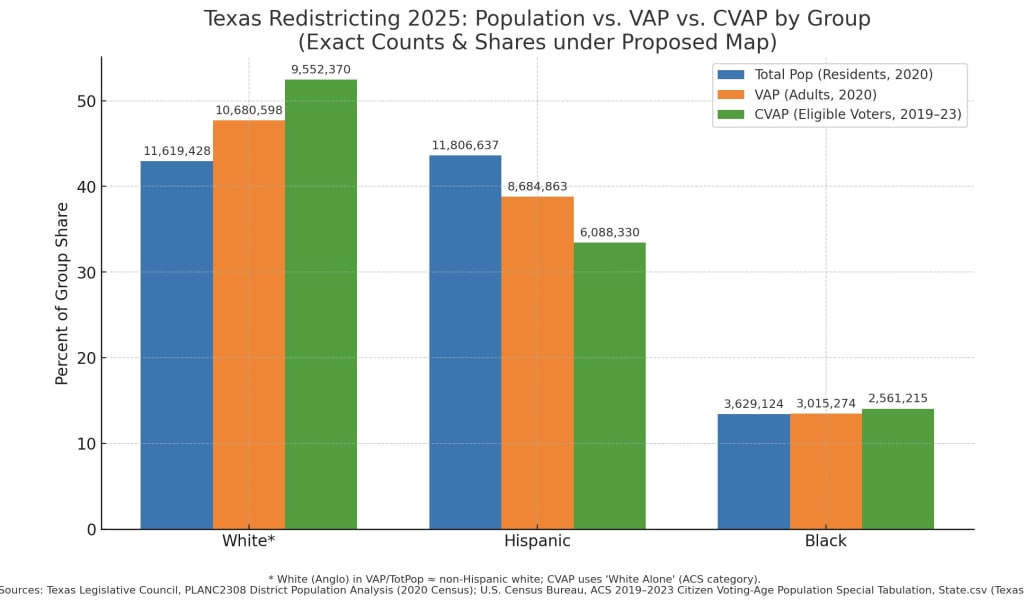
What the Chart Shows
The bar chart accompanying this text makes it clear:
• White Texans: 40% of residents, 53% of eligible voters
• Hispanic Texans: 41% of residents, 32% of eligible voters
•Black Texans: 12% of residents, 14% of eligible voters
These shifts between total population and CVAP are not gotchas. They are reality. And reality does not disappear because it is politically inconvenient.
Note: Figures shown in the chart focus on White (non-Hispanic), Hispanic, and Black. Other racial and ethnic groups account for the remaining share of Texas’s total population of approximately 29.15 million in the 2020 Census.
Why This Matters for Public Debate
When elected officials, elephants, donkeys, or otherwise, cite figures without saying whether they mean residents, adults, or eligible voters, they are not informing the public. They are constructing a narrative. That is not transparency; it is advocacy dressed as fact. In the case of PLANC2308, the claim that Latino and Black “citizens” are worth only fractions of a White “resident” collapses under scrutiny, because the meaningful comparison is citizen to citizen, not citizen to resident.
The Public’s Right to Clarity
The PLANC2308 map, submitted in July 2025, is public record. Any citizen with an internet connection can find the same data. And they should, because clarity is not the privilege of insiders; it is the lifeblood of self-government. Without accuracy and transparency, redistricting debates devolve into a contest of who can craft the most viral soundbite.
Sunlight is not optional. Accuracy is not negotiable. If you want equality at the ballot box, start by telling the public the truth about who is actually holding the ballots.
Sources
•Texas Legislative Council. PLANC2308 District Population Analysis with County Subtotals, July 29, 2025.
•U.S. Census Bureau. 2020 Decennial Census.
• U.S. Census Bureau. Citizen Voting Age Population (CVAP) Special Tabulation, 2019–2023 American Community Survey, 5-Year Estimates.
About the Creator
Mike Barvosa
Texas-based educator. Always listening.
I write about what we ignore, where memory fades, systems fail, and silence shouts louder than truth. My stories don’t comfort. They confront.
Read them if you're ready to stop looking away.
Keep reading
More stories from Mike Barvosa and writers in The Swamp and other communities.
The Redistricting Scam Nobody Wants to Fix
Everyone’s talking about gerrymandering again, but almost no one is talking about the bigger structural flaw baked into the system. And if you think this is just about Republicans or Democrats, you are already missing the point.
By Mike Barvosa7 months ago in The Swamp
A Gathering of Evil Bosses
“I’m the queen of chin jutting while I smooth my hair, attacking, insulting, and deflecting to protect my appointer.” “Oh, please, Blondi, my hair is curled, highlighted, and longer than yours. I feature television commercials telling immigrants that we will give them a free plane ride home, and if they voluntarily turn themselves in, they will be allowed to legally apply for re-entry. It runs everywhere, and I look good in it! You can’t compete because of your blond hair. Mine is nicer, and my lips are prettier than yours.”
By Andrea Corwin 22 days ago in The Swamp
Royal Navy Crowsnest airborne surveillance helicopters deployed to Cyprus
Deployment strengthens British monitoring capability in the Eastern Mediterranean amid regional tensions. The United Kingdom has deployed a number of airborne surveillance helicopters equipped with the advanced Crowsnest radar system to Cyprus, strengthening its ability to monitor activity across the Eastern Mediterranean. The move comes as regional tensions continue to rise and the UK enhances its military readiness to support allies and protect strategic interests. The helicopters, operated by the Royal Navy, are part of Britain’s airborne early-warning capability designed to detect aircraft, ships and potential threats over long distances. Mounted on AgustaWestland Merlin HM2 helicopters, the Crowsnest system provides radar coverage that significantly extends the situational awareness of naval forces operating at sea. Strategic Deployment to Cyprus The aircraft have been deployed to the UK’s sovereign base areas in Cyprus, which serve as a critical hub for British military operations in the Middle East and Mediterranean region. From these bases, the helicopters can monitor wide swathes of airspace and maritime routes stretching across the eastern Mediterranean. Military officials say the deployment is designed to enhance intelligence gathering and early warning capabilities during a period of heightened regional uncertainty. The Eastern Mediterranean has become an increasingly important strategic area due to ongoing conflicts, shipping routes and the presence of multiple international military forces. The move also supports broader British defence efforts in the region, particularly as the UK positions naval assets to respond quickly to potential crises. What the Crowsnest System Does The Crowsnest system represents the Royal Navy’s latest generation of airborne surveillance technology. It is designed to provide airborne early warning and control, enabling naval commanders to detect and track aircraft, missiles and ships far beyond the radar horizon of surface vessels. Unlike traditional ship-based radar systems, airborne platforms can scan a much larger area because of their higher altitude. This allows the radar to identify potential threats earlier and provide commanders with more time to respond. Mounted beneath the Merlin helicopter’s fuselage, the Crowsnest radar can rotate and scan the surrounding airspace while transmitting data back to ships, command centers and allied forces. Military analysts say this capability is especially important for protecting high-value naval assets such as aircraft carriers and amphibious ships. Support for Carrier Operations The helicopters are closely linked with the operations of the HMS Prince of Wales, one of the UK’s two large aircraft carriers. Crowsnest-equipped helicopters typically operate as part of a carrier strike group, providing the airborne surveillance necessary to detect incoming threats before they reach the fleet. By deploying the helicopters to Cyprus, the Royal Navy can maintain surveillance coverage even when the carrier itself is not immediately present in the region. The move also ensures that trained crews and equipment are positioned close to potential operational areas. Defence officials have stressed that such deployments are routine components of the UK’s global military posture, though they often become more visible during periods of geopolitical tension. Importance of the Cyprus Bases The United Kingdom maintains two sovereign base areas on Cyprus — RAF Akrotiri and Dhekelia — which have long served as forward operating locations for British and allied forces. Their proximity to the Middle East allows rapid response to developments in several strategically sensitive regions. These bases have been used for surveillance missions, humanitarian operations, evacuation efforts and coalition military campaigns over the years. Aircraft operating from Cyprus can monitor maritime traffic in the Mediterranean and provide support to naval forces operating further south or east. With tensions in the Middle East continuing to fluctuate, the bases remain one of Britain’s most important overseas defence installations. Enhancing Regional Monitoring The deployment of the Crowsnest helicopters reflects the increasing importance of surveillance and early warning in modern military operations. Detecting threats early allows commanders to coordinate defensive measures, deploy intercepting aircraft, or adjust naval formations before hostile forces approach. For the Royal Navy, maintaining a robust surveillance network is essential for safeguarding both British forces and allied vessels operating in the region. Preparedness in an Uncertain Environment While British officials have not indicated that the helicopters are preparing for immediate combat operations, the deployment highlights the UK’s readiness to respond to evolving security challenges. By positioning airborne surveillance assets close to potential areas of instability, the UK ensures it can monitor developments in real time and support allied forces if required. As geopolitical tensions persist across several parts of the Middle East and Eastern Mediterranean, the presence of advanced systems like Crowsnest underscores the role of technology and preparedness in maintaining maritime security.
By Fiaz Ahmed 5 days ago in The Swamp
Becca
"Everything is so... flat." Denille said stupidly as she looked around her new neighborhood. She looked around at the muted desert where even the smallest sign of life seemed to have given up. The plant life was shrubs that were half cooked by the heat and where there should have been a lawn, a mess of white rocks laid glistening in the sun. Even the sky looked stretched thin, like the sun had ironed it smooth. She’d moved from Riverside, where at least there were hills, but here in Barstow, everything felt baked and brittle.
By Sara Wilson7 days ago in Fiction


Comments
There are no comments for this story
Be the first to respond and start the conversation.