
The Retention Mirage
Why Cohort Analysis Beats Annual Metrics Every Time


For those of you who know me well, you’ll know by now that I’m a diehard fan of analogies and this post will be no different!
As we enter one of the most consistently busy times of year for M&A and deal activity, I had the opportunity to join Chris Scalley and the team at River Through Atlanta on the Chattahoochee river to chase wild brown trout on the fly.

October is not only one of the best times of the year to get out and enjoy an otherwise quiet river, but this time we had an incredible opportunity to witness the Department of Natural Resources’ quarterly “electro fishing” survey. (More on this here). Now before I had the chance to watch exactly how the DNR would carry out this survey I expected, perhaps, that they would net a fish, weigh and measure the fish, and then release and carry on again to the next fish.

However, what Chris astutely pointed out was that in doing so, you would run the risk of measuring the same fish twice, skewing weight and length metrics, and possibly run the risk of injuring fish by putting them through the exercise over and over again.
What happens in reality is that every fish that is caught is put into an oxygenated livewell and held there until they can count, weigh, and (in some instances) tag the fish in “cohorts” and release as the data is gathered.
While I am not suggesting that we should gather and collect customers (or customer metrics) and hold in a tank, there is a remarkably similar approach to measuring customer and dollar retention that is consistently overlooked by business owners, board members, and advisors alike.
The Comfortable Lie of “Annual” Net Retention
Every board deck has it - the single slide that sums up customer loyalty in one tidy percentage: “Annual Net Retention: 110%”
It looks reassuring. It implies durability. But more often than not, it hides more than it reveals.
Annual retention tells you what happened; Cohort retention tells you why. In a world where capital is increasingly expensive and growth must be efficient, understanding “why” is everything.
The Illusion Beneath the Average
Annual retention is a blended average. It combines customers acquired at different times, through different channels, under different pricing and product conditions - all into one number. The simplicity is misleading.
Example:
Two SaaS companies both report 110% annual net retention.
- Company A: Retention is stable and improving. Each new cohort stays longer.
- Company B: Early customers are loyal, but new ones churn at double the rate.
Same headline number. Completely different businesses.
Company A compounds; Company B decays quietly - until the problem is too big to ignore.
Furthermore, in a world where S&M resources (and dollars) are increasingly expensive, ignoring the cost of recent customer acquisition in conjunction with that respective cohort’s retention & performance skews sales efficiency metrics as well.
What Cohort Retention Actually Measures
Cohort retention groups customers by when or how they joined (for example, by signup month, acquisition channel, or product version) and then tracks their behavior over time.
Let’s dig into the “Illustrative Company” below and parse out cohorts by signup “year” (although channel and product version are equally important to measure).
Our “Illustrative Company” is an 80%+ grower with 138% “Net Retention” and ~$1M in ARR. All great metrics on the surface.
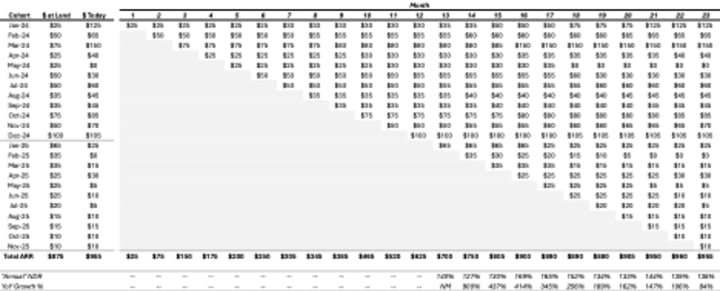
However, when we begin to dig into the ASP of the newer cohorts as well as the retention trends of the 2025 vintage compared to the 2024 vintage, the numbers tell an entirely different story.
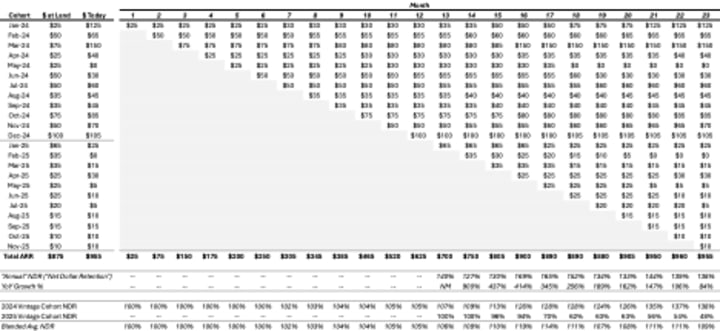
The 2025 vintage ASP (of $25k) is half of its neighboring 2024 cohort ASP (at $50k) and the delta between Cohort NDR is even more significant.
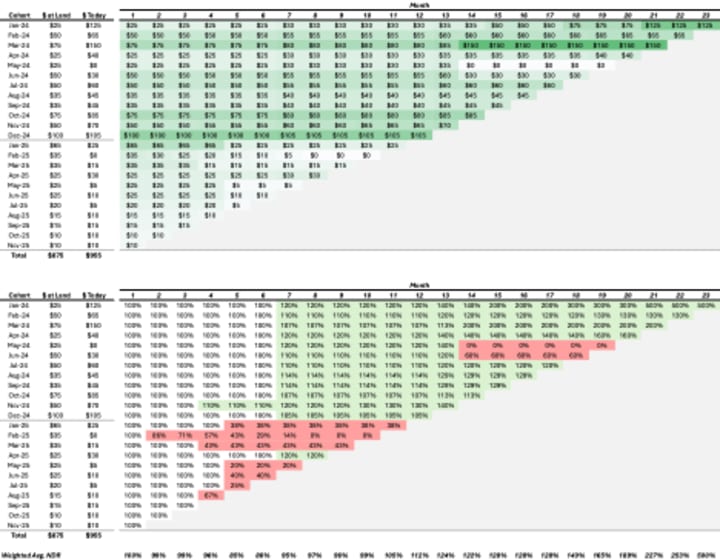
Cohort Momentum: The Real Leading Indicator
In an ideal world, each new cohort retains better than the one before; signaling learning, product maturity, and an improved ICP refinement.
Cohort momentum is the slope of improvement - not just how many customers you keep, but whether you’re getting better at keeping them.
When cohort curves flatten or decline, it’s an early warning sign of decaying product-market fit or inefficient growth. When they improve, it’s evidence of scalable durability - the holy grail for both founders and investors.
How Founders Can Operationalize Cohort Retention
Cohort analysis isn’t just for advisors and board meetings - it’s a management tool.
Here’s how to make it part of your operating framework:
1. Measure retention in monthly or quarterly “Cohorts”.
Track cohorts by signup month or quarter, not just annually. This captures shifts tied to new channels, features, or pricing.
2. Segment your cohorts.
Group by 1) acquisition channel, 2) customer tier, or 3) geography. You’ll quickly note which growth engines actually produce long-term customers.
3. Tie cohorts to revenue and LTV.
Retention curves mean more when paired with revenue. Plot retained revenue per cohort over time - it’s the clearest signal of compounding value creation.
4. Look for the slope.
Flat or improving retention curves mean your product’s getting better. Declining ones mean you’re losing grip on your customer base - even if top-line ARR still looks good.
Why Investors Care (and Should)
For PE and growth investors, cohort analysis is the best way to separate durable, consistent growth from artificial growth and lumpiness in Net New ARR growth and customer concentration.
Annual retention can be distorted by reacquired churned customers, discount-driven renewals, or expansion masking decay.
Cohort analysis strips out the noise. It exposes whether the business’s underlying customer quality is improving or deteriorating.
In diligence, cohort analysis helps investors:
- Identify decaying acquisition channels.
- Assess post-acquisition performance.
- Evaluate whether a business compounds or just replenishes churn.
If annual retention tells you what happened, cohort retention tells you what will happen next.
Why This Matters More Than Ever
In the era of cheap capital, headline metrics could mask inefficiency. Founders could buy growth faster than they were losing customers.
Today’s capital markets reward efficiency, predictability, and durability. Cohort retention is the single best proxy for all three.
Because it doesn’t just describe customer behavior, it describes whether the business itself is learning, improving, and compounding over time.
The Bottom Line
If your business depends on recurring revenue, stop treating retention as a static number. Start treating it as a motion.
Annual retention tells you whether customers stayed.
Cohort retention tells you whether your business is getting better.
And that difference is everything - because the companies that win aren’t the ones with the prettiest retention slides. They’re the ones whose newest cohorts are their strongest yet.
About Trevor Lunsford

Trevor Lunsford is a tenured M&A executive with 8+ years of experience across both investing and advisory. Trevor specializes in the vertical and application SaaS ecosystems within GovTech, Public Safety, eCommerce, HCIT, MarTech, and EdTech markets. Here he shares his learnings over the last several years – writing about SaaS metrics, business durability, and the intersection of strategy and execution.
Follow Trevor on LinkedIn or subscribe for future articles on operational excellence and value creation.
About the Creator
Trevor Lunsford
Trevor Lunsford is a Director of M&A and Investment Banking at Union Square Advisors with more than 8 years of experience in sell-side and buy-side M&A advisory, specializing in advising vertical SaaS companies and their investors.
Keep reading
More stories from writers in Journal and other communities.
Airport Robots Market: When Machines Take the Terminal
The terminal feels alive long before sunrise. Lights flicker on, cleaning crews finish their rounds, and travellers roll suitcases across polished floors. Then something unusual passes by. It does not rush. It does not tire. It moves with quiet confidence, scanning, assisting, and working without pause.
By william jack4 days ago in Journal


Comments