
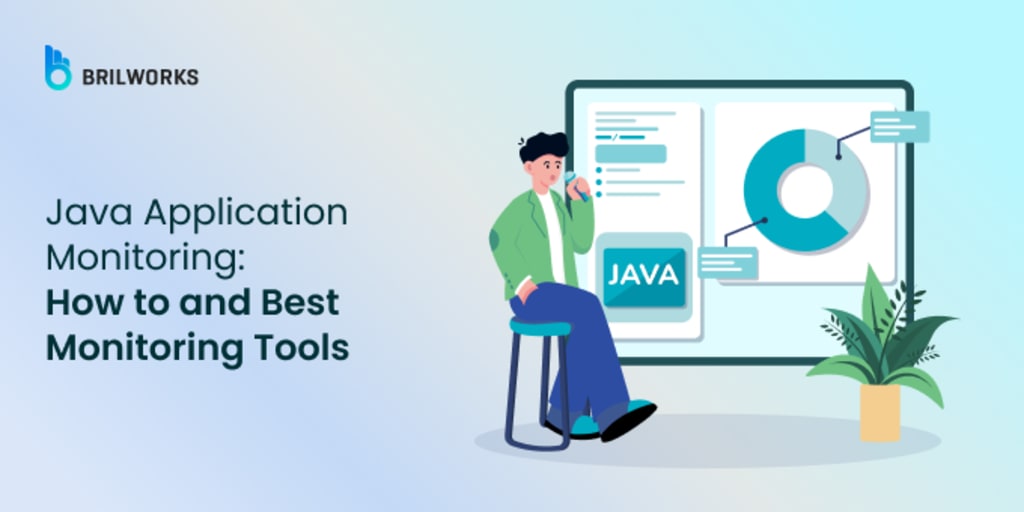
Java Performance Monitoring: How to & Best Tools to Use
Discover how to optimize your Java applications with effective Java performance monitoring. Explore the best tools and techniques to track, analyze, and improve Java performance in real time.
When it comes to business success, application performance is everything. A single second of lag can impact your organization's reputation. In fact, McKinsey's recent research shows that app performance isn't just a technical detail-it directly impacts business success. By monitoring and optimizing an app's performance, businesses can achieve up to 35% higher revenue growth.
A seamless app experience builds trust and loyalty with your audience. Your app is the most important connection between your business and its customers-so why risk friction? For Java enterprise apps, the stakes are even higher. As the backbone of enterprise applications, performance optimization is crucial.
It's not just about writing clean code-it's about continuously monitoring and refining your app's performance. Java performance monitoring opens the door to insights that help you optimize and fine-tune your strategy.
In this article, we will learn about Java application performance monitoring, discuss what Java application performance monitoring is, its importance and popular tools and best practices to monitor the Java application.
Let's get to Java application performance monitoring. In a nutshell, this involves using specialized tools and strategies to track performance, identify optimization areas, and let things just hum along smoothly. One finds more than just bottlenecks, one finds the points with which one can fine-tune for improvements in efficiency. It includes checking into key metrics-like CPU usage and memory usage, as well as all other performance factors.
However, to truly optimize, you need to understand what's happening behind the scenes. That's exactly what we'll dig into in this part of the blog.
One way is by using Java profiling tools, which give you insights into various performance aspects of your app. With the right tools in place, you'll be able to spot opportunities to fine-tune your Java app's performance with less effort.
Another approach is Java's garbage collection mechanism, which can also boost your app's performance.
So to wrap it up, you want tools that are like allies; they work fast to indicate to you what is taking space and performing in terms of performance. Combine all these, and you will find that there is a solid monitoring strategy that works for Java application performance. Let's dive into both of these processes and see how they help in the management of Java app performance.
Before we go down to the nitty-gritty of Java application monitoring, let's take a quick look at Java garbage collection and how monitoring tools play their role.
Five ways to improve Java application performance
Java applications can sometimes slow down, and it's not fun when things aren't running smoothly. Whether it's sluggish code or memory issues, there are a few simple tweaks you can make to get things back on track. Here are five easy ways to boost your Java app's performance:
1. Start with Code Profiling
Think of code profiling as a way to shine a flashlight on the dark corners of your application. It helps you spot what's slowing things down. With profiling tools like VisualVM or JProfiler, you can figure out which parts of your code are taking too much time or hogging memory.
Why bother? Because finding and fixing those problem areas early can save you headaches later. Plus, tools like these make it much easier than trying to hunt for issues manually.
2. Say No to Recursion
Recursion might seem like a smart move-it breaks big problems into smaller chunks-but in Java, it's a costly strategy. Why? Java doesn't handle recursion as efficiently as some other languages, which can lead to performance issues or even crashes.
Instead, go for loops. Loops do the same job but are much less demanding on memory and processing. If you're dealing with something that really needs recursion, try a stack-based solution to manage it better.
3. Make Your Logs Work Smarter with Tracing
Logs are great for spotting issues, but they can get messy fast. Tracing adds an extra layer of clarity, helping you follow what's going wrong and where.
Here's how to make it work:
- Use tools like ELK Stack or Zipkin to organize and search through logs.
- Label your logs clearly-things like thread names, classes, and methods make debugging faster.
- Look for patterns in errors and exceptions to tackle recurring problems.
With good tracing, you're not just fixing errors-you're stopping them from popping up again.
4. Use StringBuilder for Heavy String Work
If your app works a lot with strings, here's a quick tip: avoid using the + operator for string concatenation. Why? Every time you combine strings this way, Java creates new objects, and that eats up memory fast.
Instead, use StringBuilder. It's faster and doesn't waste memory because it changes the same object instead of creating new ones. For tasks like building big strings from smaller parts, it's a lifesaver.
5. Fix Performance Bottlenecks (Hint: It's Often Garbage Collection)
A lot of performance problems in Java apps come down to garbage collection (GC). If your app's memory (heap) is too big, GC takes longer to clean things up, which means more delays.
Here's what you can do:
- Keep an eye on GC with tools like GCViewer or Eclipse Memory Analyzer.
- Adjust the heap size so it's just right-big enough to avoid frequent GC but not so big that it slows everything down.
- Use JVM flags like -XX:+UseG1GC to fine-tune how GC works for your app.
Fixing these bottlenecks can make your app feel way faster without rewriting a ton of code.
Read the full article here.
About the Creator
Vikas Singh
Vikas is the Chief Technology Officer (CTO) at Brilworks, leads the company's tech innovations with extensive experience in software development. He drives the team to deliver impactful digital solutions globally.
Keep reading
More stories from Vikas Singh and writers in Journal and other communities.
How Exception Handling Works in Java
When you are writing code, things don’t always go as planned. Sometimes, unexpected errors pop up, like a file not being found or a network failure. To handle these situations, Java provides a structured approach — an exception handling mechanism.
By Vikas Singhabout a year ago in Journal
🅼🅸🅳🅽🅸🅶🅷🆃 🆂🅽🅰🅲🅺🆂
"It's 10 in Tuscon! We all know what that means... It's Time for Midnight Snacks with your man, Gerald Gee! Ready to spend the night together? Me too! I'm full of snacks and can't wait to regurgitate them all back into your hungry ears. Crack a brew! Pop some corn! Anything to get ready for one hell of a show where the talk maybe cheap but the words cut deep...
By Lamar Wiggins3 days ago in Fiction


Comments
There are no comments for this story
Be the first to respond and start the conversation.