


Essential Python Libraries to build your career in Data Science
1. NumPy:
- Efficient numerical operations and array manipulation.
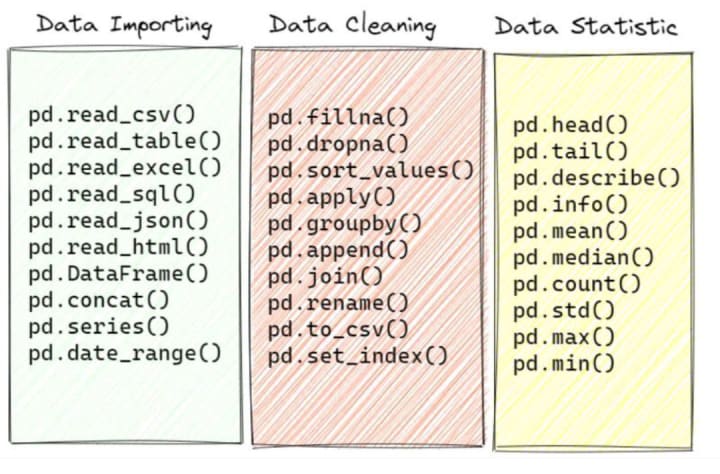
2. Pandas:
- Data manipulation and analysis with powerful data structures (DataFrame, Series).
3. Matplotlib:
- 2D plotting library for creating visualizations.
4. Seaborn:
- Statistical data visualization built on top of Matplotlib.
5. Scikit-learn:
- Machine learning toolkit for classification, regression, clustering, etc.
6. TensorFlow:
- Open-source machine learning framework for building and deploying ML models.
7. PyTorch:
- Deep learning library, particularly popular for neural network research.
8. SciPy:
- Library for scientific and technical computing.
9. Statsmodels:
- Statistical modeling and econometrics in Python.
10. NLTK (Natural Language Toolkit):
- Tools for working with human language data (text).
11. Gensim:
- Topic modeling and document similarity analysis.
12. Keras:
- High-level neural networks API, running on top of TensorFlow.
13. Plotly:
- Interactive graphing library for making interactive plots.
14. Beautiful Soup:
- Web scraping library for pulling data out of HTML and XML files.
15. OpenCV:
- Library for computer vision tasks.
As a beginner, you can start with Pandas and NumPy for data manipulation and analysis. For data visualization, Matplotlib and Seaborn are great starting points. As you progress, you can explore machine learning with Scikit-learn, TensorFlow, and PyTorch.
Data analyst vs data scientist:
- Data analysts analyse what has happened
- Data scientists try to predict what will happen
- Both use similar tools, but their focus differs.
Visualisation is key for both, but more so for DAs as DS lean towards model building.
Learn Data Science in 2024
𝟭. 𝗔𝗽𝗽𝗹𝘆 𝗣𝗮𝗿𝗲𝘁𝗼'𝘀 𝗟𝗮𝘄 𝘁𝗼 𝗟𝗲𝗮𝗿𝗻 𝗝𝘂𝘀𝘁 𝗘𝗻𝗼𝘂𝗴𝗵 📚
Pareto's Law states that "that 80% of consequences come from 20% of the causes".
This law should serve as a guiding framework for the volume of content you need to know to be proficient in data science.
Often rookies make the mistake of overspending their time learning algorithms that are rarely applied in production. Learning about advanced algorithms such as XLNet, Bayesian SVD++, and BiLSTMs, are cool to learn.
But, in reality, you will rarely apply such algorithms in production (unless your job demands research and application of state-of-the-art algos).
For most ML applications in production - especially in the MVP phase, simple algos like logistic regression, K-Means, random forest, and XGBoost provide the biggest bang for the buck because of their simplicity in training, interpretation and productionization.
So, invest more time learning topics that provide immediate value now, not a year later.
𝟮. 𝗙𝗶𝗻𝗱 𝗮 𝗠𝗲𝗻𝘁𝗼𝗿 ⚡️
There’s a Japanese proverb that says “Better than a thousand days of diligent study is one day with a great teacher.” This proverb directly applies to learning data science quickly.
Mentors can teach you about how to build a model in production and how to manage stakeholders - stuff that you don’t often read about in courses and books.
So, find a mentor who can teach you practical knowledge in data science.
𝟯. 𝗗𝗲𝗹𝗶𝗯𝗲𝗿𝗮𝘁𝗲 𝗣𝗿𝗮𝗰𝘁𝗶𝗰𝗲 ✍️
If you are serious about growing your excelling in data science, you have to put in the time to nurture your knowledge. This means that you need to spend less time watching mindless videos on TikTok and spend more time reading books and watching video lectures.
10 commonly asked data science interview questions along with their answers
1️⃣ What is the difference between supervised and unsupervised learning?
Supervised learning involves learning from labeled data to predict outcomes while unsupervised learning involves finding patterns in unlabeled data.
2️⃣ Explain the bias-variance tradeoff in machine learning.
The bias-variance tradeoff is a key concept in machine learning. Models with high bias have low complexity and over-simplify, while models with high variance are more complex and over-fit to the training data. The goal is to find the right balance between bias and variance.
3️⃣ What is the Central Limit Theorem and why is it important in statistics?
The Central Limit Theorem (CLT) states that the sampling distribution of the sample means will be approximately normally distributed regardless of the underlying population distribution, as long as the sample size is sufficiently large. It is important because it justifies the use of statistics, such as hypothesis testing and confidence intervals, on small sample sizes.
4️⃣ Describe the process of feature selection and why it is important in machine learning.
Feature selection is the process of selecting the most relevant features (variables) from a dataset. This is important because unnecessary features can lead to over-fitting, slower training times, and reduced accuracy.
5️⃣ What is the difference between overfitting and underfitting in machine learning? How do you address them?
Overfitting occurs when a model is too complex and fits the training data too well, resulting in poor performance on unseen data. Underfitting occurs when a model is too simple and cannot fit the training data well enough, resulting in poor performance on both training and unseen data. Techniques to address overfitting include regularization and early stopping, while techniques to address underfitting include using more complex models or increasing the amount of input data.
6️⃣ What is regularization and why is it used in machine learning?
Regularization is a technique used to prevent overfitting in machine learning. It involves adding a penalty term to the loss function to limit the complexity of the model, effectively reducing the impact of certain features.
7️⃣ How do you handle missing data in a dataset?
Handling missing data can be done by either deleting the missing samples, imputing the missing values, or using models that can handle missing data directly.
8️⃣ What is the difference between classification and regression in machine learning?
Classification is a type of supervised learning where the goal is to predict a categorical or discrete outcome, while regression is a type of supervised learning where the goal is to predict a continuous or numerical outcome.
9️⃣ Explain the concept of cross-validation and why it is used.
Cross-validation is a technique used to evaluate the performance of a machine learning model. It involves spliting the data into training and validation sets, and then training and evaluating the model on multiple such splits. Cross-validation gives a better idea of the model's generalization ability and helps prevent over-fitting.
🔟 What evaluation metrics would you use to evaluate a binary classification model?
Some commonly used evaluation metrics for binary classification models are accuracy, precision, recall, F1 score, and ROC-AUC. The choice of metric depends on the specific requirements of the problem.
About the Creator
Bahati Mulishi
Practical advice on remote work, IT careers, and professional skills to help you stay work-ready anywhere in the world.
Keep reading
More stories from Bahati Mulishi and writers in Geeks and other communities.
No Other Choice (2025)
It is only February, so other films may well surpass “No Other Choice”, but I think this is the best film I’ve seen so far this year. And that surprises me, because, it is a subtitled film and while I am pretentious enough to choose to watch foreign-language films, I was also very tired and that was an extra commitment from me. But more importantly, let me warn you, this film is gruesome and violent. There were times I had to turn away from the screen to avoid the worst of it (including some self-inflicted dentistry).
By Rachel Robbins23 days ago in Geeks


Comments
There are no comments for this story
Be the first to respond and start the conversation.