
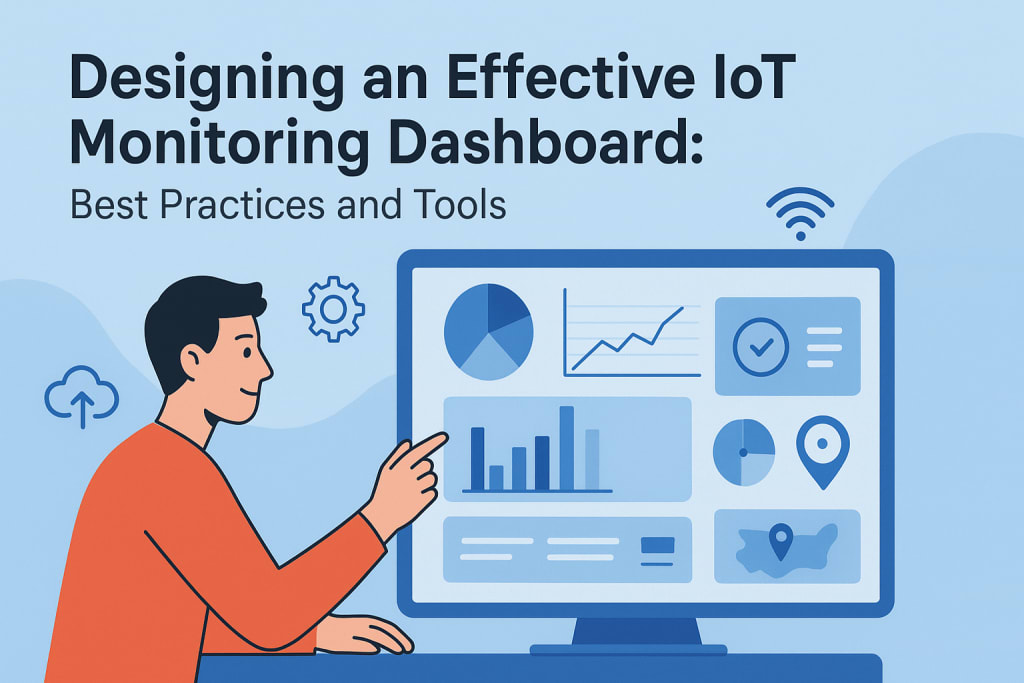
Designing an Effective IoT Monitoring Dashboard: Best Practices and Tools
Simplifying IoT Monitoring with the Right Design Approach and Tools

The Internet of Things (IoT) is revolutionizing industries by providing the ability to monitor and manage a network of connected devices in real time. IoT solutions are integral to modern business operations, ranging from manufacturing to smart cities. According to a 2023 Statista report, the global number of connected IoT devices is expected to exceed 30 billion by 2030. However, with this rapid growth, businesses face the challenge of managing vast amounts of data. An IoT monitoring dashboard serves as the central hub for tracking and visualizing data from these connected devices, helping businesses optimize operations and make informed decisions.
Designing an effective IoT monitoring dashboard is critical for maximizing the potential of your IoT system. It’s not just about displaying data; it's about presenting information in a way that is both meaningful and actionable. This article will explore the best practices and tools for designing an efficient IoT monitoring dashboard that enhances operational efficiency, reduces downtime, and improves decision-making.
What is an IoT Monitoring Dashboard?
An IoT monitoring dashboard is a digital interface that collects, processes, and displays data from IoT devices in real time. It aggregates key metrics, alerts, and performance indicators from various connected devices, providing users with a comprehensive overview of system health, status, and trends. These dashboards are used across industries to monitor everything from production lines in factories to environmental conditions in smart buildings.
Key Benefits of an Effective IoT Monitoring Dashboard
Before diving into design strategies, it’s essential to understand the impact of an effective IoT dashboard. Here are the key benefits:
- Real-Time Monitoring: Instant access to critical data ensures that decision-makers can act immediately to address issues.
- Proactive Maintenance: Predictive capabilities enable early detection of equipment issues, reducing unplanned downtime.
- Data Visualization: Effective visualization of complex data enables quicker interpretation and analysis.
- Centralized Control: An IoT dashboard centralizes data from various devices, providing a single point of control and analysis.
- Increased Operational Efficiency: By monitoring device performance and system health, businesses can optimize resource allocation and improve processes.
Best Practices for Designing an Effective IoT Monitoring Dashboard
Designing a dashboard that is both intuitive and efficient requires understanding the needs of the end user and the purpose of the dashboard. The following best practices are essential to ensure that your IoT dashboard solutions deliver maximum value.
1. Focus on Key Metrics and KPIs
Not all data is equally important. To prevent dashboard clutter and information overload, focus on displaying the key performance indicators (KPIs) that matter most for the business or operations being monitored.
- Select Relevant Metrics: Identify the metrics that provide actionable insights. For example, in a factory setting, metrics like machine downtime, production rates, and equipment health should be prioritized.
- Segment Data by Relevance: Use different sections or tabs on the dashboard for various types of data (e.g., operational data, environmental data, machine health).
- Clear Prioritization: Highlight critical metrics that require immediate attention, such as system failures or abnormal device performance, using color coding or notifications.
Example:
In a smart home monitoring dashboard, relevant KPIs might include energy consumption, room temperature, device status (on/off), and security alerts.
2. Keep It Simple and Intuitive
One of the primary goals of an IoT monitoring dashboard is to provide users with easy access to actionable information. Complexity and confusion will only hinder decision-making. Therefore, the design should be intuitive and user-friendly.
- Minimalist Design: Avoid clutter by presenting only essential data points. Use whitespace effectively to separate different sections.
- Clear Layout: Organize information logically, such as grouping related data in rows or sections. Ensure the layout is easily navigable and that critical data is readily visible.
- Interactivity: Allow users to interact with the dashboard through filtering, sorting, or drilling down into more detailed data when necessary.
Example:
In a fleet management system, the dashboard might show the real-time location of vehicles, their current speed, fuel levels, and maintenance status. Clicking on a vehicle's icon could provide more detailed information.
3. Prioritize Real-Time Data and Alerts
In the context of IoT, timely information is crucial. Therefore, your dashboard should provide real-time data that is constantly updated. Additionally, it should be capable of generating alerts based on predefined conditions.
- Live Data Feeds: IoT dashboards should be connected to real-time data sources, ensuring that the displayed information is always current.
- Customizable Alerts: Set up notifications for anomalies or critical thresholds. For instance, in a smart factory, an alert can be triggered if a machine's temperature exceeds a safe limit.
- Visual Indicators: Use color-coded indicators (red for issues, green for normal) to help users quickly assess the status of devices or systems.
Example:
An industrial IoT monitoring dashboard may include real-time data such as temperature, pressure, and operational status for each piece of equipment. A temperature spike in a machine can trigger an immediate visual alert for operators to take action.
4. Ensure Scalability and Flexibility
As the number of connected devices in an IoT network grows, so will the data that needs to be monitored. A good IoT dashboard should be scalable and flexible enough to handle increasing amounts of data and adapt to evolving user needs.
- Modular Design: Use a modular dashboard design that allows for easy addition of new data sources or features without disrupting the existing structure.
- Customizable Views: Provide users with the ability to customize their dashboards based on the specific metrics they need to track. For instance, a manager may want a high-level view, while a technician needs detailed device data.
- Integration with Other Tools: Ensure the dashboard can integrate with other business systems like ERP or CRM platforms to provide a holistic view of operations.
Example:
A smart agriculture dashboard may initially monitor soil moisture, temperature, and crop health, but it can be expanded to include weather forecasts or irrigation system status as new IoT devices are added.
5. Data Security and Privacy
As IoT devices collect sensitive information, data security becomes a priority. Ensure that your IoT monitoring dashboard is designed to protect this data and prevent unauthorized access.
- User Access Controls: Implement role-based access control (RBAC) so that only authorized users can access certain data.
- Data Encryption: Ensure that all data transmitted between IoT devices and the dashboard is encrypted to protect it from cyber threats.
- Audit Trails: Track user activity and interactions with the dashboard to help identify potential security risks.
Example:
A healthcare IoT monitoring dashboard that tracks patient vitals and medical equipment must ensure that only authorized medical professionals can access sensitive patient data.
Popular Tools for Designing IoT Monitoring Dashboards
To create an efficient IoT dashboard, you need the right tools. Several platforms and frameworks offer IoT dashboard solutions with the necessary features and capabilities.
1. Grafana
Grafana is an open-source tool widely used for data visualization and monitoring. It integrates with a variety of data sources and offers advanced features such as alerting, dynamic dashboards, and custom plugins.
Best For: Real-time monitoring, interactive dashboards
Features: Multi-data source support, rich visualization options, alerting
2. Power BI
Microsoft’s Power BI is a business analytics tool that allows users to create visually appealing and interactive dashboards. It is particularly useful for integrating IoT data with other business systems.
Best For: Business intelligence integration, enterprise-level solutions
Features: Data transformation, custom visualizations, AI-powered insights
3. ThingSpeak
ThingSpeak is an open-source platform specifically designed for IoT applications. It enables users to collect, analyze, and visualize data from IoT devices. ThingSpeak is particularly useful for IoT projects that need to be monitored remotely.
Best For: IoT sensor data visualization, remote monitoring
Features: Real-time data analysis, built-in MATLAB support for data analytics
4. Klipfolio
Klipfolio is a cloud-based dashboard platform that allows users to create real-time visualizations of IoT data. It offers easy integration with hundreds of data sources, making it highly adaptable.
Best For: Customizable dashboards, team collaboration
Features: Data connectors, multi-source integration, real-time updates
Conclusion
Designing an effective IoT monitoring dashboard is a critical task that involves understanding both user needs and data requirements. By focusing on key metrics, keeping the design simple, prioritizing real-time data, ensuring scalability, and addressing security concerns, businesses can create a dashboard that provides actionable insights and improves operational efficiency.
Whether you’re monitoring production equipment, managing fleet operations, or overseeing a smart building, an IoT monitoring dashboard plays a crucial role in enabling businesses to stay ahead of potential issues and make data-driven decisions. By leveraging the right design principles and tools, businesses can optimize the full potential of their IoT ecosystem and drive meaningful results.
About the Creator
William Smith
I am an informative tech blogger exploring a wide range of topics, including web, mobile, IoT, etc.
Keep reading
More stories from William Smith and writers in FYI and other communities.
How IoT is Revolutionizing Industries: Real-World Use Cases and Benefits
The Internet of Things (IoT) has been making waves in recent years, transforming industries by providing deeper insights, improving operational efficiencies, and creating new business models. From manufacturing to healthcare, retail, and agriculture, IoT is becoming an integral part of everyday business processes. According to a report by Statista, the global number of IoT devices is expected to surpass 30 billion by 2025, highlighting the significant role IoT will play in the future of technology. In this article, we’ll explore how IoT is revolutionizing industries with real-world use cases and tangible benefits, as well as the role of IoT development services in helping businesses integrate these technologies.
By William Smith5 months ago in FYI


Comments
There are no comments for this story
Be the first to respond and start the conversation.