
"Understanding Kurtosis and How to Determine if Your Data has a Normal Distribution."
Understanding Kurtosis
What is Kurtosis?
Kurtosis is a statistical term that measures the degree of peaked Ness or flatness of a distribution compared to the normal distribution. A distribution with high kurtosis has a sharp peak and fat tails, indicating that it has a higher probability of extreme values than a normal distribution. On the other hand, a distribution with low kurtosis has a flatter peak and thinner tails, indicating that it has a lower probability of extreme values than a normal distribution.
For example, consider the following two distributions:
- A normal distribution with mean = 0 and standard deviation = 1. This distribution has a kurtosis of 0, indicating that it has the same peakedness as the normal distribution.
- A uniform distribution between -1 and 1. This distribution has a kurtosis of -1.2, indicating that it is flatter than the normal distribution and has lower probability of extreme values.
In practical terms, kurtosis is useful for identifying whether a data set has outliers or is skewed. High kurtosis can indicate the presence of outliers or heavy tails, while low kurtosis can indicate that the data is more normally distributed.
Kurtosis is a useful statistical tool with a variety of practical applications. Here are a few examples:
- Financial Analysis: In finance, kurtosis is used to measure the risk associated with an investment. Assets with a high kurtosis value have more extreme returns, which means they are riskier than assets with a low kurtosis value. Portfolio managers can use kurtosis to identify investments that are more or less risky and adjust their portfolios accordingly.
- Quality Control: In manufacturing, kurtosis can be used to measure the consistency of a product. A distribution with high kurtosis indicates that there are more extreme values, which means the product is less consistent. Quality control engineers can use kurtosis to identify products that are more or less consistent and adjust their production processes accordingly.
- Image Processing: In image processing, kurtosis is used to identify regions of an image that have sharp transitions in brightness or contrast. These regions are often associated with edges in the image, which can be used to extract features for image recognition or analysis.
- Environmental Science: In environmental science, kurtosis can be used to measure the level of pollution in a sample of air or water. High kurtosis values indicate that there are more extreme values in the sample, which may be associated with pollutants. Environmental scientists can use kurtosis to identify samples that are more or less polluted and take appropriate action.
In general, kurtosis is a useful tool for identifying patterns in data and making informed decisions based on those patterns. By understanding the properties of a distribution, we can make more accurate predictions about future outcomes and take appropriate actions to mitigate risk or improve quality
Excess Kurtosis & Type
Excess kurtosis, also known as kurtosis excess, is a measure of how much a distribution deviates from a normal distribution in terms of its peaked Ness and tails. It is defined as the kurtosis of a distribution minus 3, which means that a normal distribution has an excess kurtosis of 0 by definition.
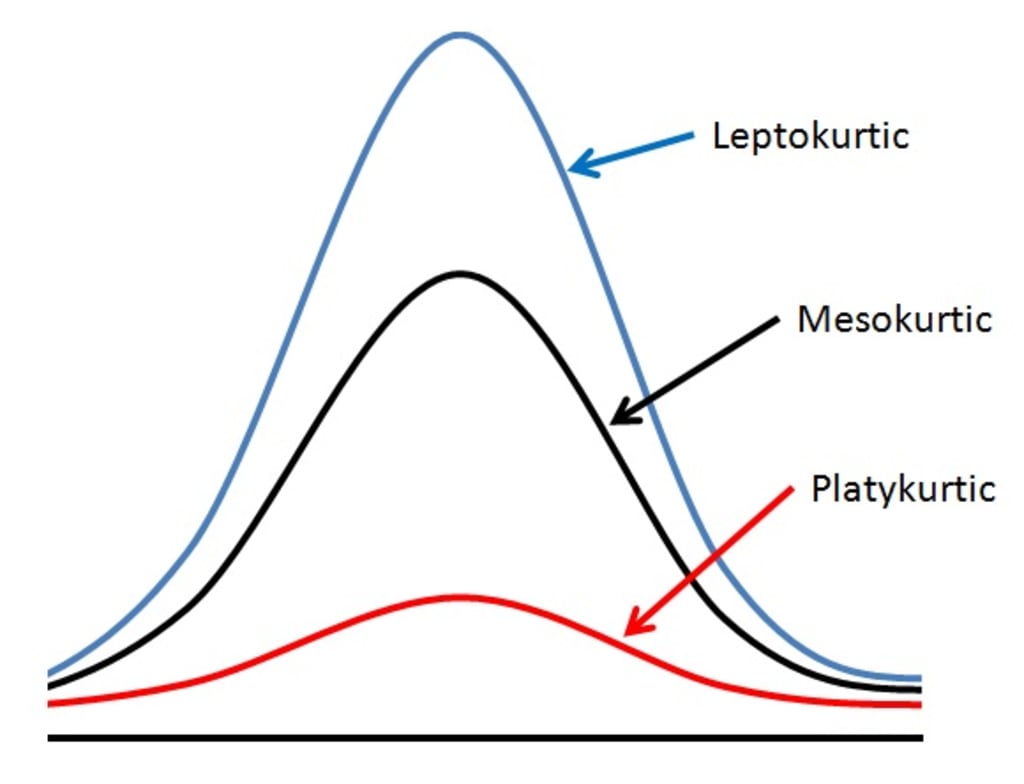
There are three types of excess kurtosis, each with different characteristics:
- Leptokurtic: A distribution with positive excess kurtosis is called leptokurtic. Leptokurtic distributions have a higher peak than a normal distribution and heavier tails, indicating that they have a higher probability of extreme values. This means that leptokurtic distributions are riskier than a normal distribution.
- Mesokurtic: A distribution with an excess kurtosis of 0 is called mesokurtic. Mesokurtic distributions have the same peakedness as a normal distribution, but may have heavier or lighter tails, depending on the distribution. This means that mesokurtic distributions are generally considered to be less risky than leptokurtic distributions.
- Platykurtic: A distribution with negative excess kurtosis is called platykurtic. Platykurtic distributions have a lower peak than a normal distribution and lighter tails, indicating that they have a lower probability of extreme values. This means that platykurtic distributions are generally considered to be less risky than leptokurtic distributions.
How to find if a given distribution is normal or not?
There are several methods to determine if a given distribution is normal or not. Here are a few common methods:
Visual inspection: One of the simplest ways to determine if a distribution is normal is to visually inspect its histogram or a Q-Q plot. A histogram of a normal distribution should have a bell-shaped curve with a symmetrical distribution of data around the mean. A Q-Q plot should show the data points following a straight line, which indicates that the data is normally distributed.
Statistical tests: Several statistical tests can be used to determine if a distribution is normal or not. These include the Shapiro-Wilk test, Anderson-Darling test, and the Kolmogorov-Smirnov test. These tests compare the distribution of the data to what would be expected from a normal distribution, and provide a p-value that indicates the likelihood that the data is drawn from a normal distribution. A low p-value (less than 0.05) indicates that the data is not normally distributed.
Summary statistics: Another way to assess normality is by calculating summary statistics such as skewness and kurtosis. A normal distribution has a skewness of 0 and kurtosis of 3. If the skewness is greater than 0 or less than 0, or if the kurtosis is greater than 3 or less than 3, the data is not normally distributed.
It's important to note that no single method can conclusively determine whether a distribution is normal or not, and a combination of methods should be used to confirm the results.
What is a QQ Plot and how is it plotted?
A Q-Q plot (quantile-quantile plot) is a graphical tool used to compare the distribution of a sample of data to a theoretical distribution, typically the normal distribution.
In a QQ plot, the quantiles of the two sets of data are plotted against each other. The quantiles of one set of data are plotted on the x-axis, while the quantiles of the other set of data are plotted on the y-axis. If the two sets of data have the same distribution, the points on the QQ plot will fall on a straight line. If the two sets of data do not have the same distribution, the points will deviate from the straight line.
Python example
https://www.statsmodels.org/dev/generated/statsmodels.graphics.gofplots.qqplot.html
statsmodels.graphics.gofplots.qqplot - statsmodels
Q-Q plot of the quantiles of x versus the quantiles/ppf of a distribution. Can take arguments specifying the parameters…www.statsmodels.org
Does QQ plot only detect normal distribution?
No
How to interpret QQ plots
- If the points on the QQ plot fall approximately along a straight line, it indicates that the sample data is well approximated by the theoretical distribution being plotted. The closer the points fall to a straight line, the closer the fit of the sample data to the theoretical distribution.
- If the points on the QQ plot deviate upwards from the straight line, it indicates that the sample data has a heavier tail than the theoretical distribution. Conversely, if the points deviate downwards from the straight line, it indicates that the sample data has a lighter tail than the theoretical distribution.
- If the points on the QQ plot deviate from the straight line in the middle, it indicates that the sample data has a different shape than the theoretical distribution. For example, if the points bulge out in the middle, it indicates that the sample data is more peaked than the theoretical distribution.
Overall, QQ plots are a useful tool for visually assessing the fit of a given sample of data to a theoretical distribution and identifying any departures from the theoretical distribution.
About the Creator
Keep reading
More stories from ajay mehta and writers in Education and other communities.
"Unlocking the Power of Chi Square: A Guide to Statistical Analysis"
Chi Square Distribution The Chi-Square distribution, also written as χ² distribution, is a continuous probability distribution that is widely used in statistical hypothesis testing, particularly in the context of goodness-of-fit tests and tests for independence in contingency tables. It arises when the sum of the squares of independent standard normal random variables follows this distribution.
By ajay mehta3 years ago in Education
Natural Ways to Clear Blackheads and Whiteheads
Blackheads and whiteheads are very common skin problems that affect people of all ages. They usually appear on the nose, chin, forehead, and sometimes on the cheeks. These small bumps form when the pores of the skin become clogged with oil, dead skin cells, and dirt. Blackheads appear dark because the clogged material inside the pore reacts with air and becomes oxidized, while whiteheads remain covered by skin, giving them a white or flesh-colored appearance.
By DigitalAddi5 days ago in Education
Peter Ayolov’s Publications
Peter Ayolov is a media theorist and lecturer at Sofia University 'St. Kliment Ohridski', Faculty of Journalism and Mass Communication. His research focuses on the political economy of communication, propaganda models, digital media, narrative structures, and the transformation of language in contemporary technological environments. His work examines how digital communication systems organise dissent, amplify outrage, and reshape the relationship between media, public opinion, and political power.
By Peter Ayolova day ago in Education
My First Time Skiing and I Got Lost, Alone, in the French Alps
Looking back, I can trace some of my life’s biggest adventures to a simple action from my sister. She’d introduced me to Tommy (a very long time ago), a colleague of hers, who had overshared his penchant for Italian-looking women, and I ticked that box.
By Chantal Christie Weissabout 7 hours ago in Humans


Comments
There are no comments for this story
Be the first to respond and start the conversation.