
The fresh new helpful indicator, Echo Forecast
This indicator uses a simple time series forecasting method derived from the similarity between recent and similar/dissimilar historical prices. We named this method “ECHO”.

We from Academy4Cryptoverse are a big community who in crypto mostly over 10 years. For many of us is just a side hustle or a hobby. However many of us have no choice during covic virus and during the recession and make trading to there main income
However, because we are a community we despise scammers that try to leech out our money for education in trading or selling Signals.Thats why we creating a source of knowledge you can not find anywhere else.
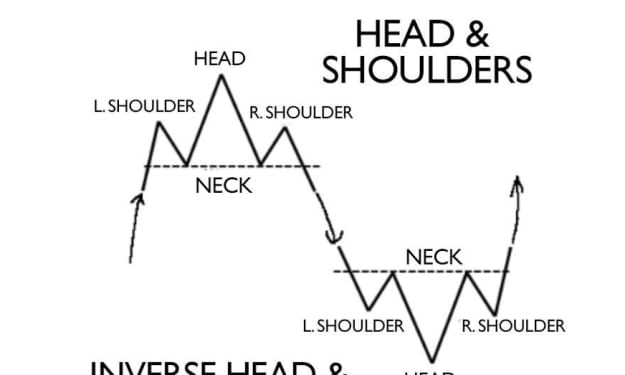
Mostly recommend trading indicators, Books about cryptocurrency investment trading staking, and online exchanges. Also candle patterns like Elliot wave, support and residence, bullish signs, and bearish signs
This indicator uses a simple time series forecasting method derived from the similarity between recent and similar/dissimilar historical prices. We named this method “ECHO”.This method predicts the future price historical series of observations most similar to the most recent price variation.
Such forecasting can prove to be relatively effective with a periodic time series. We later introduced the ability to select different series of observations for further experimentation.
This forecasting technique is closely inspired by the analog method introduced by Lorenz for the prediction of atmospheric data.

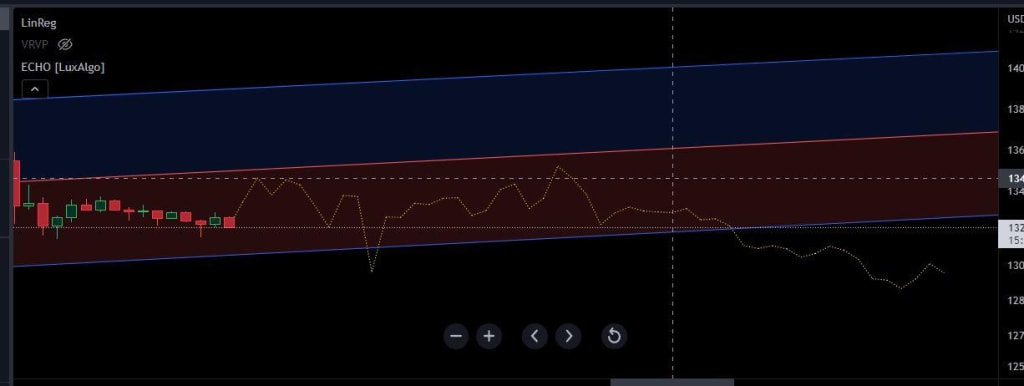
As you can see in the two pictures above, we using the Line Reg indicator with it.
The Linear Regression Indicator plots the ending value of a Linear Regression Line for a specified number of bars; showing, statistically, where the price is expected to be. For example, a 20 period Linear Regression Indicator will equal the ending value of a Linear Regression line that covers 20 bars.The interpretation of the Linear Regression Indicator is similar to that of a moving average although it does have an advantage when compared to a moving average.
Instead of plotting an average of past price action, it is plotting where a Linear Regression Line would expect the price to be, making the Linear Regression Indicator more responsive than a moving average.
However, like every Indicator we represent we backtested, and to be honest, we are still insecure and it should be used with caution. For short-term trading scalping and flat times ( no price moving), this tool is unpredictable and makes you feel secure about where it should go. We have to do more research in the higher time charts, I do not use the trend box as you can see in the picture below it could only work in the 1-hour chart and not really helpful for trend forecast.
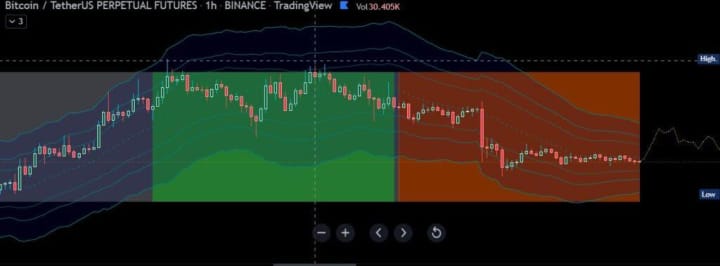
However, combined with other tools like Linear Regression Indicator (LinReg) or Bollinger Bands (Fibb) showing above it can help you do predict the trend.
By the way we are a big fan of Bollinger band indicators, specially Fibb, and have a nice post about it, but we will write about it next time soon.
Bollinger Bands® Fibonacci Ratios are based on the same principles as the standard Bollinger Bands®. The base line is a simple moving average. Bands are calculated using Welles Wilders smoothed average true range (ATR). Each band is a fibonacci ratio of the ATR away from the base line.
We should also mention that our community is split about the Echo indicator. Some used. it with success and some failed to use it probably.
You should give it a try and check it out. It would be great if you could give us a short feedback here on our Website , or on Twitter, Facebook, or Pinterest to share your thoughts.
That would be great and help our community to grow for independent knowledge, every bit help.
About the Creator
Logan
The most resourceful free information about cryptocurrencies.We all about knowledge and education.
Dr. Richard Kannwischer on Christian Community in a Digital Age: Koinonia and the Ethics of Belonging
Dr. Richard Kannwischer is Senior Pastor of Peachtree Presbyterian Church and has served more than 25 years in pastoral ministry. He earned a Master of Divinity from Princeton Theological Seminary and a Doctor of Ministry from Fuller Theological Seminary. A gifted communicator, he is passionate about helping people see how the story of God speaks with clarity, depth, and relevance to everyday life. His preaching and writing blend theological rigor with storytelling, making complex truths accessible and engaging. Whether in the pulpit, on the page, or in conversation, he invites audiences into practical, life-giving Christian faith for seekers and believers.
By Scott Douglas Jacobsen6 days ago in Education
Where Wisdom Meets Action: The Deep Connection Between Culture, Education, and Service
In any thriving society, specific values act as the foundation for growth, unity, and identity. Among these, culture, higher education, and service stand out as essential pillars. While they may operate in different spheres, they are deeply connected by a shared purpose — to empower individuals and strengthen communities through knowledge, empathy, and tradition.
By Carmen Reid6 days ago in Education


Comments
There are no comments for this story
Be the first to respond and start the conversation.