
The best reversal (Head and Shoulder) Pattern Explained
We will explain here in detail The best reversal (Head and Shoulder) Pattern Explained). Any chart model signals to the trader that the price of an asset usually will move in one or another direction after the one has finished forming. In this article, we will consider a situation when an up- or downtrend is replaced by the opposite one.


We will explain here in detail The best reversal (Head and Shoulder) Pattern Explained). Any chart model signals to the trader that the price of an asset usually will move in one or another direction after the one has finished forming. In this article, we will consider a situation when an up- or downtrend is replaced by the opposite one.
The TA patterns which tell us about possible trend reversal are head and shoulders, double bottom or double peak, and triple bottom or triple peak.
Criteria:
- The 1st obligatory criterion, which is not followed by most, for some weird reason – the asset must have an uptrend before the appearance of the reversal shape. The longer it is, the better.
- The left shoulder and the peak of the head form an uptrend without any doubt in it. The first alarming bell rings when the price reaches a 100% (approximately) rollback from the top of the head. This is a signal of the decrease in demand for the asset and the weakness of bulls.
- The second alarming bell approaches with the appearance of the right shoulder. It represents a maximum that formed lower than the previous maximum (of the head). In other words, the buyers are not in shape to provide the continued growth of price and the asset is in an apparent limbo: has not yet changed to the downward trend, but has definitely stopped growing.
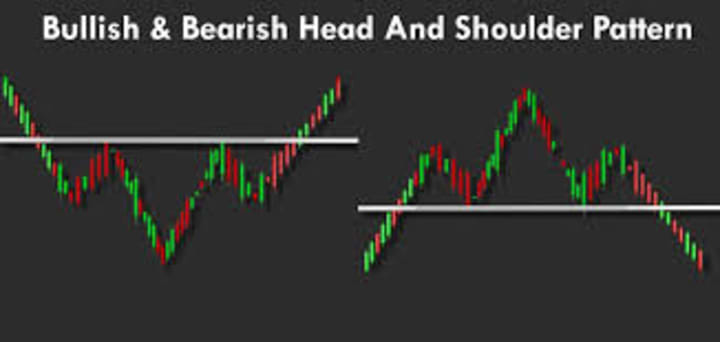
- In the picture above the neck and shoulders are marked with a horizontal line. This is a typical support level next to which there is an increased demand from the bulls’ side, which also does not allow the price to fall lower. It is important to note that it does not have to be strictly horizontal. Often the neck has an upwards or a downward direction. But this moment does not change its essence.
- The third bell, not alarming, but final, appears when the asset has fallen below the level of support (neck). All of the conditions that answer to the downward tendency have formed: decreasing minimums and maximums. Now the market is ruled by bears.
- The last, but very important moment: the weakness of the trend is confirmed by trading volumes throughout the formation of the whole H&S pattern.
Thus, we have 6 rules, to which the classic or bearish H&S pattern should correspond. For an inverted or bullish version of one, you need to look for opposite conditions. For the example of the chart look lower:
How to trade:
Now we will look at three different ways to trade this model. Each of them corresponds to different trading styles. Just as before, we will consider the classic (bearish) option:
- The standard way of opening a position – we enter the market immediately after the breakthrough of the level of support (neck). The candle that corresponds to the breakthrough must move with increased volumes. This is critical! Stop-loss we place either above the level or slightly above the right shoulder.
- The aggressive method for opening a position – we enter the market when the peak of the right shoulder has formed, in other words, after the second alarming bell. As was mentioned beforehand, the asset is in limbo: we are not yet certain if the trend will reverse. The stop-loss we place is a bit higher than the maximum of the right shoulder or the head.
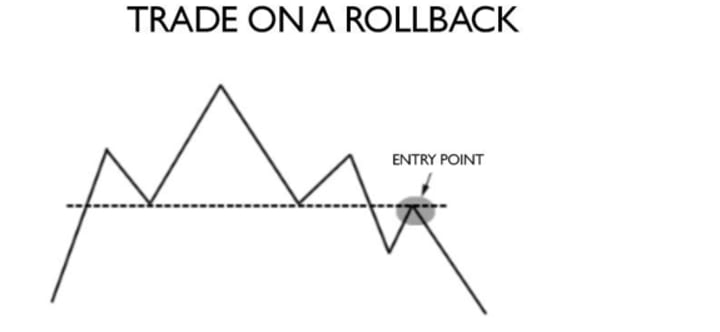
- The conservative way to open a position. Enter the position of the breakthrough, when the price returns to the support level and confirms it. The stop-loss, without any other possible variation, we place after the neck level. Schematically
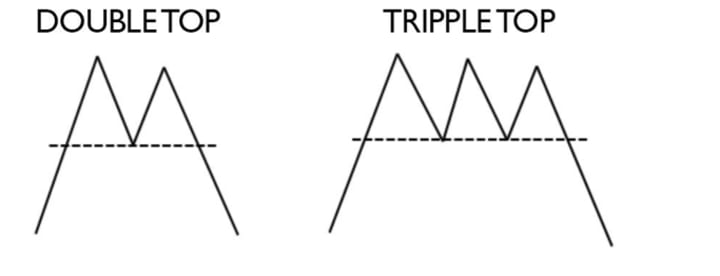
Criteria:
- The 1st on – the presence of an uptrend. The longer and more powerful an uptrend is, which precedes the reversal triple or double top, the better because this tells us that many traders are interested in the asset.
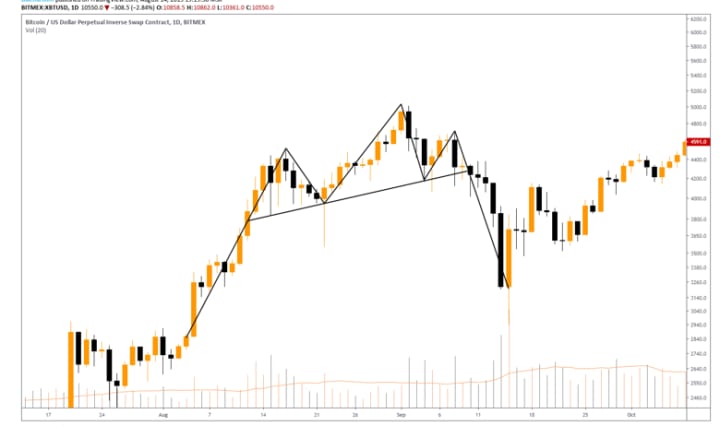
- The analysis of the peaks themselves does not tell us much. Ideally, the second maximum should be slightly lower than the first (or on the same level), and the third, consequently, should be even lower. All of these points tell us about the weakness of bulls, because they have raised the price for a significant amount of time, and then have abruptly stopped. But, never just write off this pattern, even if each subsequent peak is slightly higher than the previous one.
- Price rollbacks from the peaks should be at least 80% of the previous upward movement. This confirms the decline in the demand for stock/coin. A healthy trend, which does not give cause for suspicion, gives rollbacks of about 50%. Everything that exceeds this value should be considered as an alarm bell.
- The final completion of the double (triple) peak pattern occurs when the price falls below the level of support. At this point, the bears have shown that they control the situation on the market.
- The last, but very important point is, of course, the trading volumes. Each subsequent peak will have ever smaller volumes. Moreover, you will notice how rollbacks are accompanied by increased trading activity, which suggests that buyers are selling their positions.
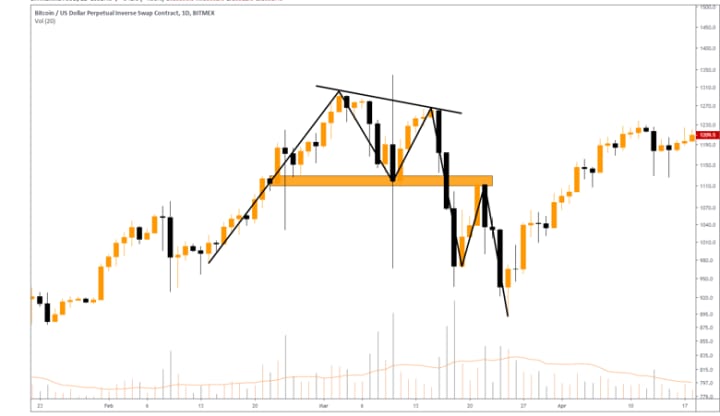
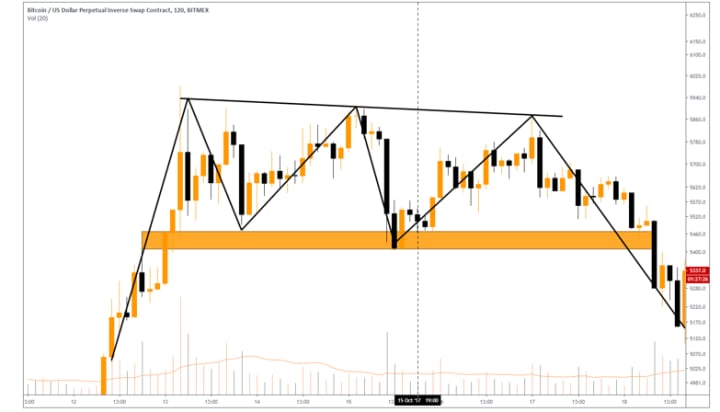
So we have five clear rules. Briefly summarized: a double top occurs after an uptrend in the form of two peaks that are approximately at the same level and have decreasing volumes. You can be confident that a pattern has formed, only after the breakthrough of the support level. The same applies to the triple-top model. Now, look at how this is depicted on the chart:
How to trade:
There are two options: either trade breakthrough or rollback. The first method is the riskiest, but you are guaranteed to have a position. The second method is more conservative, but stocks do not always roll back to the level and you can be left without any position. In general, the price is falling faster than growing, so trading breakthrough in this case is a more reliable option.
- The standard way to open a position is to enter the market immediately when the support level is broken through. Stop-loss is best placed just above the support level. No need to take the stop too far from the entry point. A good trade is a good trade from the very beginning. So try to minimize stop-loss within the acceptable range.
- A conservative way to open a position – we calmly observe how the stock breaks through the support level and falls below it. We enter the market when the price returns to the level, that is, during the first rollback. Stop-loss, lacking any other option, we set slightly above the level. This is the best trading option for a swing trader, since here the risks are low and the opportunity to get profit is great.
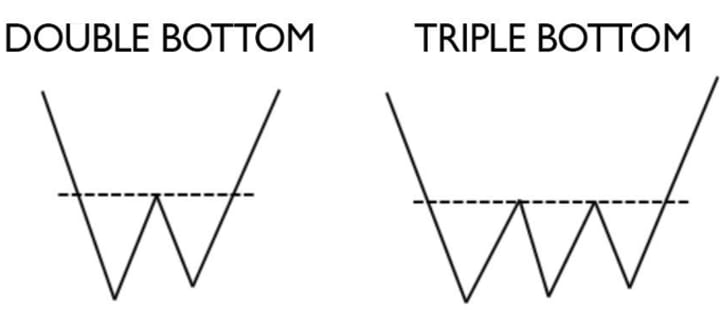
Double and triple bottom.
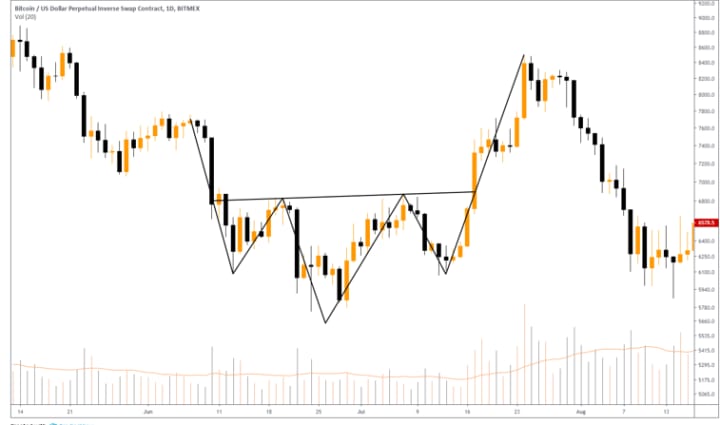
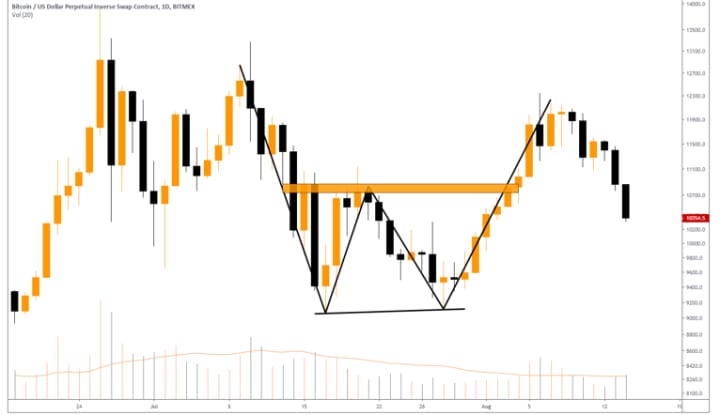
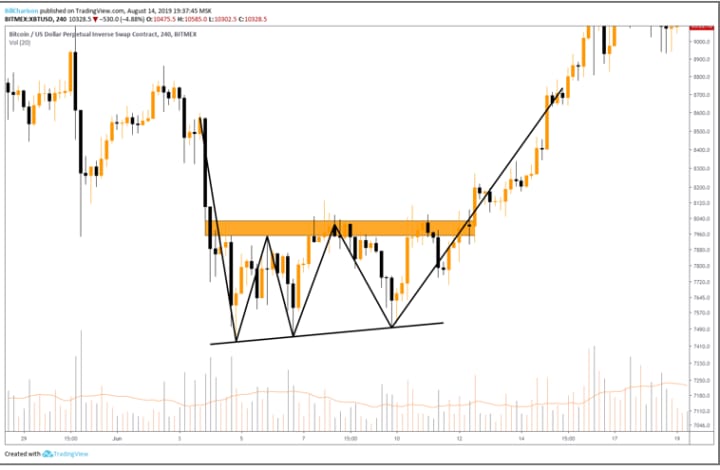
Both the double bottom and the triple bottom are reversal patterns that appear at the bottom of the downtrend, and that are signaling its possible transition to the upward trend. These patterns are inverted triple and double-top patterns. And although there are no radical differences between them, nevertheless, let us consider the conditions for the formation of a triple and double bottom, to avoid the feeling of incompleteness.
Criteria:
- The very first condition that you should look for on the chart is a downtrend. Never forget about this. The stronger and longer it is, the greater chances that the new upward movement that you are going to trade will be just as powerful and profitable.
- The double bottom is similar to the letter W, that is, two formed minimum levels are approximately at the same level. Although you will often see that the second bottom is located slightly higher than the first, which indicates the weakness of sellers who have been dumping the price for a long time and suddenly could not overcome the resistance of buyers. The same goes for the triple-bottom model. But, do not neglect the figures in which the lows go in a downward line. The main thing is the analysis of rollbacks.
- The most important condition is rollbacks (or recovery from minimums). They should be at least 80% of the previous downward movement. You can use Fibonacci levels to measure, although everything can be seen with the naked eye. Remember, a trend does not cause doubt if its rollbacks make up about 50% of the previous price movement. A significant increase in these numbers should lead to suspicion.
- We can say that the triple or double bottom pattern is completed only after breaking through the resistance level. This suggests that the market is under full control and an uptrend is expected.
- Of course, each pattern of technical analysis is confirmed by trading volumes. Each subsequent minimum will be traded on ever smaller volumes, which indicates a decrease of the strength of sellers. You will notice how price recovery on rollbacks is accompanied by an increase in trading activity. This indicates an increase in demand for stocks/coins and an infusion of money from new buyers.
We got five specific rules for a double bottom and for a triple bottom. The main thing to consider is the presence of a clear downtrend. Sooner or later, it will end, and perhaps the main indicator of this will be the double-bottom or triple-bottom model.
How to trade:
Typically, traders use two methods: they either trade breakthrough, or rollback. These figures are bullish, that is, we expect an upward movement after their appearance. And since the bullish trend makes the price roll back to the level much more often than the bearish trend, then you can focus only on the rollback trade. This type of trading is less drawn and allows you to use the closest possible Stop Losses.
- The standard way to open a position is to enter the market immediately when the support level is broken through. Stop-loss is best placed just above the support level. No need to take the stop too far from the entry point. Try to minimize stop-loss within the acceptable range.
- The conservative way to open a position – we calmly respond to a breakthrough and further upward price movements. We enter the market only when the stock returns to the level of resistance and confirms it as support. This technique is called first rollback trading. I love it because it allows you to execute a deal with a small stop-loss and risk.
About the Creator
Logan
The most resourceful free information about cryptocurrencies.We all about knowledge and education.
Top 4 AI certifications to Land High-Paying Jobs in 2026
With artificial intelligence becoming a core business necessity in 2026, and organizations moving towards Agentic AI systems along with specialized infrastructure, the demand for professionals who can build, deploy, integrate, and even use these intelligent systems is growing.
By Anu shreya4 days ago in Education
UniversityGPT: In Defence of Gen-Z in the Age of Artificial Intelligence
Every generation is shaped—and judged—by the tools it adopts. From the printing press to the calculator, from the internet to smartphones, technological change has always been met with suspicion. Today, that suspicion has a new name: UniversityGPT. As AI-powered tools become increasingly common in academic spaces, Gen-Z finds itself under fire. Critics argue that students are “outsourcing thinking,” undermining academic integrity, and becoming intellectually dependent. Yet these arguments reveal more about the fear of change than about the realities of modern learning. Defending Gen-Z is not about excusing laziness—it is about recognizing evolution. Understanding Gen-Z: A Generation Born into Complexity Gen-Z, generally defined as those born between the mid-1990s and early 2010s, is the first generation to grow up in a fully digital, globally connected world. Unlike Millennials, who witnessed the rise of the internet, Gen-Z was born into it. But technology is only one part of their story. This generation came of age during: Global financial instability Climate change emergencies Political polarization A worldwide pandemic Rising tuition fees and student debt An unpredictable job market They inherited a world that is faster, harsher, and more demanding than ever before. To expect them to navigate this reality using outdated educational models is unrealistic. Gen-Z is not disengaged. They are overloaded. The Rise of UniversityGPT and Academic Anxiety UniversityGPT has become a lightning rod in debates about AI in education. For many educators and commentators, it represents everything that feels out of control: automation, speed, and the erosion of traditional authority. But history shows us a pattern. When calculators were introduced, students were accused of “forgetting math.” When Google became common, students were accused of “not researching properly.” When spell-checkers appeared, writing was said to be “dead.” None of these fears came true. Instead, expectations shifted. UniversityGPT is not the enemy of learning—it is the next phase of it. AI Does Not Replace Thinking—It Changes Where Thinking Happens One of the most persistent myths about AI tools is that they eliminate critical thinking. In reality, they reposition it. When students use UniversityGPT responsibly, they still must: Frame intelligent questions Assess the accuracy of responses Compare multiple viewpoints Edit, refine, and personalize ideas Apply concepts to real-world contexts AI generates information. Humans generate meaning. In fact, effective AI use requires higher-order thinking skills such as evaluation, synthesis, and judgment—skills that traditional rote learning rarely develops. Knowledge Is No Longer Scarce—Insight Is Previous generations learned in a world where access to information was limited. Libraries, textbooks, and lectures were gatekeepers of knowledge. Gen-Z lives in a different reality. Information is abundant. What is scarce is: Context Interpretation Ethical judgment Creativity UniversityGPT helps students move past mechanical tasks and focus on deeper understanding. This is not intellectual laziness—it is strategic efficiency. In a world driven by speed and complexity, efficiency is not a shortcut. It is survival. Outdated Education Systems Are the Real Crisis Much of the criticism aimed at Gen-Z ignores a fundamental truth: education systems have not evolved at the same pace as the world. Many universities still rely on: Memorization-based exams Rigid curricula One-size-fits-all assessments Minimal mental health support Underpaid and overworked faculty Students are expected to perform at elite levels within systems designed for a pre-digital era. Gen-Z did not create these contradictions—they exposed them. UniversityGPT gained popularity because it fills gaps left by institutional stagnation. Academic Integrity in the Age of AI The conversation around AI often centers on cheating. But cheating is not new—technology did not invent dishonesty. What AI does demand is new definitions of integrity. Instead of banning AI outright, institutions should be teaching: Ethical AI use Citation and transparency Critical evaluation of AI-generated content Responsible collaboration between human and machine Punishment-based approaches ignore reality. Education-based approaches prepare students for the future. Gen-Z understands that AI is not going away. They want guidance, not fear. Gen-Z and the Courage to Question Authority One reason Gen-Z unsettles traditional systems is simple: they ask uncomfortable questions. They question: Why education is increasingly expensive Why unpaid internships are normalized Why productivity is prioritized over wellbeing Why outdated traditions are protected without evidence UniversityGPT empowers this questioning by giving students faster access to knowledge and alternative perspectives. This is not rebellion—it is intellectual independence. Mental Health Awareness Is Not Weakness Another common criticism is that Gen-Z is “too sensitive.” In reality, they are simply more honest. They speak openly about: Anxiety Burnout Depression Emotional exhaustion Previous generations were taught to endure silently. Gen-Z chooses to address problems openly. UniversityGPT can reduce academic stress by: Helping organize thoughts Clarifying complex material Reducing time pressure Supporting non-native English speakers Using AI to manage cognitive load is not weakness—it is self-care. A healthy mind is essential for meaningful learning. Adaptation Is the Highest Form of Intelligence Human history favors those who adapt. Gen-Z is preparing for a future where: AI is embedded in every profession Jobs evolve constantly Lifelong learning is essential Collaboration with machines is normal Learning how to work with AI is not optional—it is foundational. UniversityGPT is not a threat to intelligence. It is a training ground for the future. The Real Question About AI in Education Instead of asking: “Why are students using AI tools like UniversityGPT?” We should be asking: “Why hasn’t education evolved to teach ethical, effective AI collaboration?” Blaming students for adapting faster than institutions is misplaced frustration. Gen-Z is not the problem. They are the preview. In Defence of Gen-Z Gen-Z is not lazy. They are overwhelmed—but resilient. Not entitled—but informed. Not disengaged—but redefining engagement. UniversityGPT does not weaken their minds. It reflects a world where intelligence is distributed, tools are powerful, and adaptability determines success. History is rarely kind to pioneers in the moment. But it is always shaped by them. When the future finally arrives, it will look remarkably like the world Gen-Z is already navigating—and mastering.
By Zahid Hussain2 days ago in Education


Comments
There are no comments for this story
Be the first to respond and start the conversation.