
All Candlestick Pattern
In this article Academy4cryptoverse we will consider all bearish and bullish candle patterns which tell us about the best follow trend. The figures of technical analysis that indicate a continuation of the trend include triangles, flags, pennants, wedges, and cups with handles.

Triangle shape: ascending, descending, symmetrical.
The basic principle of the triangle pattern- is two lines that move to one (same) point, and between them, the price swing. You will see three types of triangles on the charts: ascending, descending, and symmetrical. Further, we will consider conditions for these patterns to work.

Criteria:
⦁ The triangle shape is a part of the trend continuation patterns. Consequently, the first condition is the existence of a trend. The ascending triangle corresponds to the upward trend, the downward - to the downward, and symmetrical - to both. Do not try to look for these patterns without seeing a trend!
⦁ The price moves within the two lines. For the ascending triangle, they are the horizontal resistance level and the trend line directed upward, for the downward one they are the horizontal support level and the trend line directed downward, for the symmetrical one there are two trend lines that move towards the same point.
⦁ A triangle shape can be formed in the presence of at least two peaks and two bottoms. This condition arises from the need for at least two points to build a line or a level.
⦁ This model is not fast. If you see a similar figure on the chart, but it lasts only a couple of days, then it can be a pennant or a wedge.
⦁ We can see that the triangle works out only after the breakthrough of a trend line or the support and resistance levels.
⦁ The last criterion, a very important one, is the trading volume. Since the price narrows its range during the formation of the pattern, then volumes should gradually decrease, as well. At the time of the breakthrough, we will observe a sharp increase in volume activity.
So, we got six clear criteria. During a downtrend or uptrend, the price consolidates between the two lines, gradually narrowing its trading range for at least a month. Trading volumes fall, following a decrease in volatility, and resume only at the time of breakthrough.


How to trade:
There is nothing special here. As in most TA patterns, we can trade either breakthrough or rollback.
⦁ The standard way to open a position is to enter the market when the price breaks through the resistance level for the upward triangle (buy), or the support level - for the downward one (sell) and the trend line - for the symmetric one. Set the Stop-Loss after the important level or trend line.
⦁ A conservative way to open a position - we are waiting for the first rollback of the price after the breakdown and only after that do we enter the market. Stop-Loss is set in the same way.
Do not forget to control trading volumes. At the time of breakthrough, they increase significantly and maintain this dynamic as the trend continues. Also do not place restrictive orders too far from the entry point. A good trade is good from the start.
The flag and pennant shape.
If you look at the schematic image of these models (below), you can notice that the pennant shape strongly resembles a symmetrical triangle. The flag shape is a parallelogram. They differ from the rest of the patterns because they are very short-lived and they develop in less than 2 weeks (including hourly time-frames).

Criteria:
In general, almost any rollback or small price consolidation on the chart can be represented in the form of these two models. That is why I said that you can face these patterns very often. Now let's look at the main criteria for their formation.
⦁ The stock should have a clear trend. This is a very important point, and the price movements before the formation of these patterns are usually choppy and active.
⦁ Price moves within two trend lines. A flag has the shape of two parallel lines, which are directed somewhat downwards on an uptrend, and upwards on a downtrend. The pennant shape is formed between two lines that are directed to a single point (like a triangle).
⦁ These chart models are quick. Of course, this is only a conditional criterion, since with a downward trend the price doesn’t linger for a long time at the same level, but with an upward trend, it can trade in the pennant range for more than a week.
⦁ The final formation of the flag or pennant patterns we observe only after the price breaks through the trend line.
⦁ Trading volumes - the last, but very important criterion. Analogically to other patterns, you have probably already guessed that during the formation of shapes, trading volumes gradually decrease. This fact tells that traders and investors do not hurry to get rid of their profitable positions and are waiting for the continuation of the initial trend. At the time of the breakthrough, trading activity immediately increases and keeps this positive dynamic as the trend develops.
So, we got five specific conditions. The main thing you should pay attention to: the flag and pennant shapes are formed in a very short time and only after a strong and sharp trend. Do not try to look for patterns to continue the trend on chaotic charts with sideways (flat) movement.


How to trade:
You can use two main trading methods there: during breakthrough or rollback. In the first case, we enter the market immediately when the price breaks through the trend line directed at the continuation of the trend. In another case, we are waiting for a rollback and only then we open a position. Stop-loss, as always, is set immediately after the important level.
The flag and pennant shapes have a so-called flagpole, which is equal to the size of the previous rise or fall of the price. This value needs to be placed upwards or downwards from the breakthrough point, and we will get a target level to which the price can rise or fall. Of course, all of this is an approximation, but in most cases, it works quite well. See the chart example below for an understanding of how this works.

riteria:
⦁ The very first and most important condition is the existence of an uptrend. Therefore, the first task for a trader is to find a leading stock/coin with a strong trend.
⦁ What does a cup look like? This is a correction of the previous trend, the walls of which are represented by the movement of the price: downwards (the left wall), and then upwards (the right one). Between them lies the bottom, which can take the form of tight consolidation, or a pointy base, as can be seen in the example above. The main condition: the cup should not correct the trend by more than 80%. In case you see that the correction is bigger than 80%, it should make you doubt this pattern's truthfulness.
⦁ What does the handle look like? This is a correction of the right wall of the cup and usually takes the form of a flag. The handle starts from the right peak of the cup, which is about the same level as its left peak. The main condition: the handle should not correct the right wall of the cup by more than 50%.
⦁ A cup with a handle is a rather slow-forming model. Its length can be from 1 to 12 months. But, the longer the price consolidates, the more strength it will have for the subsequent movement.
⦁ The final formation of the cup with the handle occurs after the breakdown of the resistance level, as shown in the example above.
⦁ Volumes gradually decrease during the formation of the left wall of the cup, remain small during the consolidation of the bottom and grow when the price moves up when the right wall appears. Trading activity increases sharply at the time of the breakthrough of the resistance level.
So, we got six clear criteria that explain the conditions for the cup and handle pattern formation. First of all - always look for an uptrend and make sure that it is not corrected above the limit values. If these conditions are violated, then there is a high probability of the formation of a false cup and handle, which can work out too, but only because of the fact that there are a lot of people who can’t draw this pattern correctly and buy after the false handle formation, which pumps the price. You can try to catch this movement, but it is more than risky.

How to trade:
⦁ The standard way to open a position is to enter the market immediately after the breakthrough of the resistance level, that is, when you are confident in the final formation of the model. Set the Stop Loss just below the level of the breakout candle.
⦁ The aggressive way of opening a position: it was already mentioned that a handle is usually a flag shape. That is, we enter the market after the breakthrough of the trend line, just as we trade a flag pattern. Set the Stop Loss under the minimum of the breakthrough candle.
⦁ The conservative way to open a position: wait for the first rollback and enter the market when you see the first reversal pattern at the bottom. Stop-loss we set slightly below the minimum of the reversal candle.
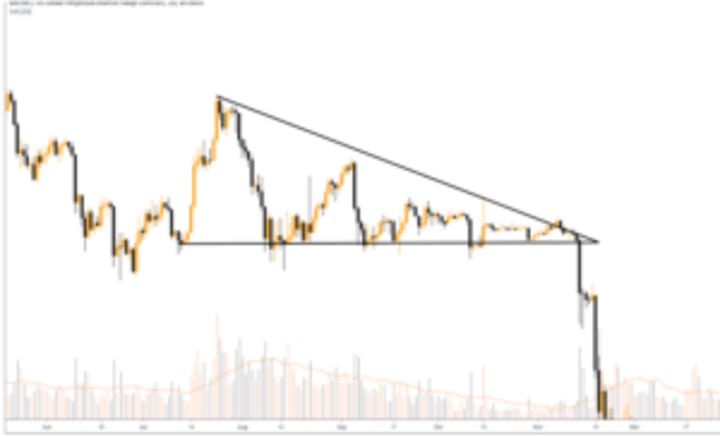
Wedge pattern: ascending and descending.
The wedge pattern is very similar to a symmetrical triangle. Why? The price moves within two trend lines that are directed at a single point. Gradually, the trading range and volatility narrow until occurs an upward or downward breakthrough.
But these two patterns have significant differences, which you will understand after reading this section.
There are two options for the wedge shape: ascending and descending. The first is also called bearish, as it indicates the continuation of a downtrend. The second is called bullish. Well, let's look at the chart conditions necessary for the wedge formation:
Criteria:
⦁ The first and one of the most important conditions is the existence of a trend, as usual. The bearish wedge should be preceded by a downtrend and the bullish - by an uptrend. This pattern is not absolute, because sometimes you will see an upwards wedge when the price moves up and a downward one when the price moves down. However, the trend must be present. Making money on the side market (flat) is very difficult!
⦁ The price consolidates within two trend lines: upward for the bearish model and downward for the bullish one. Peculiarity: the lines are not parallel, and one of them (generally, through which the breakdown will be made) has a greater slope than the other. Thus, they are directed at a single point, as in the formation of a triangle.
⦁ To build a wedge, we need at least two peaks and two bottoms. Remember, a trend line can only be drawn through two points.
⦁ A wedge pattern in opposition to a flag and pennant is not quick.
⦁ We can conclude that the formation of this pattern has finalized only after its breakthrough.
⦁ The last condition - declining volumes. The more the trading range and volatility narrow during the wedge development, the smaller volumes we see. This fact tells that med-long-term traders are not rushing to close their profitable positions and are waiting for the continuation of the initial trend. At the time of the breakthrough, volumes increase significantly and support this trend as the trend develops.

How to trade:
⦁ The standard way to open a position is to enter the market when the price breaks through the resistance line toward the continuation of the main trend. Usually, the trend line is the resistance, which has a larger slope. Set the Stop Loss either under the level or slightly below the minimum of the breakthrough candle (this is for a downward wedge).
⦁ Conservative way to open a position - we expect the first rollback after a breakthrough. This is a less risky option since you already know that the wedge has completely formed, and the stock/coin has started the trend again. But, sometimes the price moves with such force that it does not give rollbacks. In that case, you can remain outside of the market. Stop-loss we place either under the level or a bit lower than the minimum of the reversal candle (this is for a downward wedge)
About the Creator
Logan
The most resourceful free information about cryptocurrencies.We all about knowledge and education.
Top 4 AI certifications to Land High-Paying Jobs in 2026
With artificial intelligence becoming a core business necessity in 2026, and organizations moving towards Agentic AI systems along with specialized infrastructure, the demand for professionals who can build, deploy, integrate, and even use these intelligent systems is growing.
By Anu shreya5 days ago in Education
UniversityGPT: In Defence of Gen-Z in the Age of Artificial Intelligence
Every generation is shaped—and judged—by the tools it adopts. From the printing press to the calculator, from the internet to smartphones, technological change has always been met with suspicion. Today, that suspicion has a new name: UniversityGPT. As AI-powered tools become increasingly common in academic spaces, Gen-Z finds itself under fire. Critics argue that students are “outsourcing thinking,” undermining academic integrity, and becoming intellectually dependent. Yet these arguments reveal more about the fear of change than about the realities of modern learning. Defending Gen-Z is not about excusing laziness—it is about recognizing evolution. Understanding Gen-Z: A Generation Born into Complexity Gen-Z, generally defined as those born between the mid-1990s and early 2010s, is the first generation to grow up in a fully digital, globally connected world. Unlike Millennials, who witnessed the rise of the internet, Gen-Z was born into it. But technology is only one part of their story. This generation came of age during: Global financial instability Climate change emergencies Political polarization A worldwide pandemic Rising tuition fees and student debt An unpredictable job market They inherited a world that is faster, harsher, and more demanding than ever before. To expect them to navigate this reality using outdated educational models is unrealistic. Gen-Z is not disengaged. They are overloaded. The Rise of UniversityGPT and Academic Anxiety UniversityGPT has become a lightning rod in debates about AI in education. For many educators and commentators, it represents everything that feels out of control: automation, speed, and the erosion of traditional authority. But history shows us a pattern. When calculators were introduced, students were accused of “forgetting math.” When Google became common, students were accused of “not researching properly.” When spell-checkers appeared, writing was said to be “dead.” None of these fears came true. Instead, expectations shifted. UniversityGPT is not the enemy of learning—it is the next phase of it. AI Does Not Replace Thinking—It Changes Where Thinking Happens One of the most persistent myths about AI tools is that they eliminate critical thinking. In reality, they reposition it. When students use UniversityGPT responsibly, they still must: Frame intelligent questions Assess the accuracy of responses Compare multiple viewpoints Edit, refine, and personalize ideas Apply concepts to real-world contexts AI generates information. Humans generate meaning. In fact, effective AI use requires higher-order thinking skills such as evaluation, synthesis, and judgment—skills that traditional rote learning rarely develops. Knowledge Is No Longer Scarce—Insight Is Previous generations learned in a world where access to information was limited. Libraries, textbooks, and lectures were gatekeepers of knowledge. Gen-Z lives in a different reality. Information is abundant. What is scarce is: Context Interpretation Ethical judgment Creativity UniversityGPT helps students move past mechanical tasks and focus on deeper understanding. This is not intellectual laziness—it is strategic efficiency. In a world driven by speed and complexity, efficiency is not a shortcut. It is survival. Outdated Education Systems Are the Real Crisis Much of the criticism aimed at Gen-Z ignores a fundamental truth: education systems have not evolved at the same pace as the world. Many universities still rely on: Memorization-based exams Rigid curricula One-size-fits-all assessments Minimal mental health support Underpaid and overworked faculty Students are expected to perform at elite levels within systems designed for a pre-digital era. Gen-Z did not create these contradictions—they exposed them. UniversityGPT gained popularity because it fills gaps left by institutional stagnation. Academic Integrity in the Age of AI The conversation around AI often centers on cheating. But cheating is not new—technology did not invent dishonesty. What AI does demand is new definitions of integrity. Instead of banning AI outright, institutions should be teaching: Ethical AI use Citation and transparency Critical evaluation of AI-generated content Responsible collaboration between human and machine Punishment-based approaches ignore reality. Education-based approaches prepare students for the future. Gen-Z understands that AI is not going away. They want guidance, not fear. Gen-Z and the Courage to Question Authority One reason Gen-Z unsettles traditional systems is simple: they ask uncomfortable questions. They question: Why education is increasingly expensive Why unpaid internships are normalized Why productivity is prioritized over wellbeing Why outdated traditions are protected without evidence UniversityGPT empowers this questioning by giving students faster access to knowledge and alternative perspectives. This is not rebellion—it is intellectual independence. Mental Health Awareness Is Not Weakness Another common criticism is that Gen-Z is “too sensitive.” In reality, they are simply more honest. They speak openly about: Anxiety Burnout Depression Emotional exhaustion Previous generations were taught to endure silently. Gen-Z chooses to address problems openly. UniversityGPT can reduce academic stress by: Helping organize thoughts Clarifying complex material Reducing time pressure Supporting non-native English speakers Using AI to manage cognitive load is not weakness—it is self-care. A healthy mind is essential for meaningful learning. Adaptation Is the Highest Form of Intelligence Human history favors those who adapt. Gen-Z is preparing for a future where: AI is embedded in every profession Jobs evolve constantly Lifelong learning is essential Collaboration with machines is normal Learning how to work with AI is not optional—it is foundational. UniversityGPT is not a threat to intelligence. It is a training ground for the future. The Real Question About AI in Education Instead of asking: “Why are students using AI tools like UniversityGPT?” We should be asking: “Why hasn’t education evolved to teach ethical, effective AI collaboration?” Blaming students for adapting faster than institutions is misplaced frustration. Gen-Z is not the problem. They are the preview. In Defence of Gen-Z Gen-Z is not lazy. They are overwhelmed—but resilient. Not entitled—but informed. Not disengaged—but redefining engagement. UniversityGPT does not weaken their minds. It reflects a world where intelligence is distributed, tools are powerful, and adaptability determines success. History is rarely kind to pioneers in the moment. But it is always shaped by them. When the future finally arrives, it will look remarkably like the world Gen-Z is already navigating—and mastering.
By Zahid Hussain3 days ago in Education
🅼🅸🅳🅽🅸🅶🅷🆃 🆂🅽🅰🅲🅺🆂
"It's 10 in Tuscon! We all know what that means... It's Time for Midnight Snacks with your man, Gerald Gee! Ready to spend the night together? Me too! I'm full of snacks and can't wait to regurgitate them all back into your hungry ears. Crack a brew! Pop some corn! Anything to get ready for one hell of a show where the talk maybe cheap but the words cut deep...
By Lamar Wiggins3 days ago in Fiction


Comments
There are no comments for this story
Be the first to respond and start the conversation.