
Nifty Put Call Ratio
An Easy Approach for Informed Traders


When it comes to stock markets, a wide range of algorithms exist to assist traders to strategise better. One of the most important and widely used indicators is the Nifty Put Call Ratio. If you have an understanding of preliminary concepts of finance and the stock market, this guide will enable you to learn about this remarkable ratio.
So how does the Put Call Ratio work and why does it matter for traders and investors? Let’s figure it out.
What is the Nifty Put Call Ratio?
The Nifty Put Call Ratio (PCR) is one of the popular technical indicators that helps in estimating the overall mood of traders regarding Nifty, which represents the Indian stock market Index (Nifty 50). This ratio is calculated using the following formula. It is equal to the open interest (OI) of a given index’s put options to that of its call options.
Formula:
Nifty Put Call Ratio = Open Interest of Puts / Open Interest of Calls
This is helpful in determining the extent to which a trader is purchasing options. In other words, it indicates whether they are more buying puts (which represent bearish sentiments) or calls (which indicate bullish sentiments).
Why Is The Nifty Put Call Ratio Considered Important?
The Nifty Put Call Ratio is one of the tools that analysts and traders use to have a basic idea of the market sentiment. With the help of this tool, one can predict if investors feel bullish (positive) or bearish (negative) regarding the Nifty index.
If PCR is high, then it means that more puts are being bought. This situation may indicate bearish or negative sentiment. But at the same time, it can also indicate that the market is oversold and there is a possibility that it may bounce back.
If the PCR is low, it means that more calls are being bought. This situation is likely to display bullish sentiment, but also shows that the market may be overbought and a correction is expected soon.
Therefore, the Nifty Put Call Ratio offers a unique insight within the ecosystem of traders’ market sentiment unlike when basing off market prices alone.
How Does the Nifty Put Call Ratio Work?
In order to understand how this particular ratio works, a person needs to know a bit about options trading.
A Put Option gives the right to sell Nifty at a certain price. When traders think that the market is going down, they expect that they will start buying puts.
The call option gives an individual the opportunity to buy a Nifty at a certain price. Traders buy calls when they expect the market to rise.
An increase in open interest of puts generally indicates that more traders expect Nifty to drop. Alternatively, an increase in open interest of calls indicates more traders expect an upsurge.
The Nifty Put Call Ratio aggregates this data and represents it in the form of a number, which is more intuitive.
How to Interpret the Nifty Put Call Ratio?
As in any analysis of the PCR, the traders’ interpretation of the ratio has to be accurate.
Here are the standard interpretations:
PCR < 0.7 (Low PCR)
This reflection suggests that there are more calls than puts.
This means the market sentiment is bullish.
However, such extreme optimism may result in overconfidence and the market may correct itself downwards.
PCR between 0.7 and 1.0 (Neutral PCR)
Moderate, balanced outlook.
It is likely that the market will be range bound or less volatile.
PCR > 1.0 (High PCR)
It indicates that there are more puts than calls.
As a result, the market is considered bearish. However, an extremely high PCR may imply that the market is too pessimistic and a spike or reversal might occur.
It is crucial to remember that the Nifty Put Call Ratio works best as a contrarian indicator, which means:
- A very high PCR could signal a shift towards bullish sentiment.
- A very low PCR could indicate a shift towards bearish sentiment.
Benefits of employing the Nifty Put Call Ratio
Below are the primary benefits of using the Nifty Put Call Ratio in trading:
Understand Market Sentiment
The Put Call Ratio provides insight regarding the perception of traders: optimistic or fearful.
Helps in Timing The Market
Used in conjunction with other indicators, the PCR can help identify the optimal market entry or exit point.
Supports Short Term Trading Decisions
Traders, especially those in intraday or swing trading, often support their trading calls using PCR as a guide.
Works as a Contrarian Tool
Put Call Ratios Tend to identify caps and extremes of emotion in the market: too much greed or too much fear, which lead to trend reversals.
Risks and Limitations of the Nifty Put Call Ratio
Just like any other tool, the Nifty Put Call Ratio has its disadvantages and should not be used indiscriminately.
Misinterpretation
Novices stand the risk of interpreting PCR incorrectly and assuming excessively high values will always mean bearish without giving context to the market.
Not a Standalone Tool
Having no bounds on the Nifty Put Call Ratio can lead to disaster. It requires complementary tools such as other technical indicators, price action, and news.
Operates Best in Extreme Emphasis areas (Zones)
It is at its best when the PCR is at the extreme highs or lows. In the mid ranges, it would struggle to offer precise readings.
Market May Go Against Sentiment
Even when PCR is showing a very high bearish sentiment, the market can still plunge further. That is the reason managing risk is always important.
A practical example of implementing the Nifty Put Call Ratio is as follows.
Consider the scenario of the Nifty 50 index trading at 20,000, with a Put Call Ratio of 1.4. This shows that more traders are buying puts compared to calls thus signifying bearish sentiment.
However, if in addition, you notice the Nifty has too suffered a lot in the preceding few days, this high PCR might suggest that the market is oversold and is likely to bounce back soon or at least trigger short covering.
Traders are likely to combine these signals with data like RSI, VOL, or even other parts of the market like support zones before making a decision.
How to Track the Nifty Put Call Ratio?
Finding the Put Call Ratio (PCR) is simple as it is available on multiple stock market sites such as:
- The NSE India website
- Stock market trading platforms such as Zerodha and Upstox
- Financial news websites and their corresponding mobile applications
All of the abovementioned platforms provide PCR updates in real time during trading hours, which is beneficial for traders.
Tips to Use Nifty Put Call Ratio Effectively
The following tips should help you utilise the ratio better:
Use it with Other Indicators: In order to obtain the most optimum result, it is best to pair it with RSI, MACD, and/or Bollinger Bands.
Do not Just Look at the Number, Track the PCR Trend: Instead of focusing solely on the number, look for an increasing or decreasing trend as it will indicate a shift in sentiment.
Observe Historical Versions of PCR: It is useful to track the current PCR alongside historical counterparts to evaluate potential outcomes.
Avoid Overtrading: Make sure you have a secondary strategy that the ratio will work in conjunction with in case trades are based on PCR data.
Final Thoughts: Should You Use the Nifty Put Call Ratio?
Correctly tracking the Nifty Put Call Ratio will allow one to ascertain market sentiments and trends more efficiently when coupled with ongoing changes within the stock market, making him or her a capable advantage against individuals keen on trading options or futures indices on Nifty.
But always keep in mind that no indicator can be relied on completely. Do not use PCR in isolation. Continue developing and refining your trading system.
Acting on the Nifty Put Call Ratio allows a trader to make better decisions and simplifies the complicated and emotional side of the stock market.
About the Creator
Amit Pandey
The Put Call Ratio shows market sentiment through options data, types of candlesticks reveal price action, the MMI Index tracks market emotions, and chart patterns help predict price trends.
Keep reading
More stories from Amit Pandey and writers in Education and other communities.
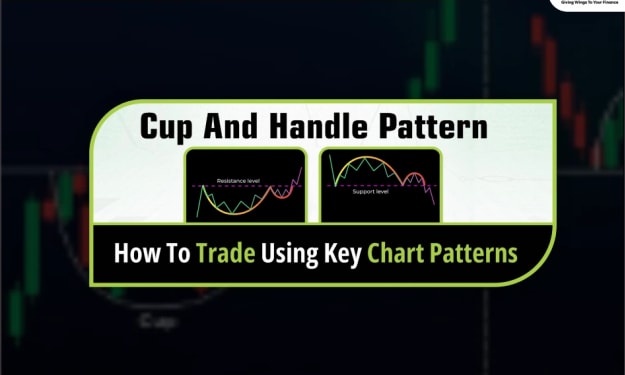
Cup and Handle Pattern
The stock market is full of patterns and signals. One such popular and reliable pattern is the Cup and Handle Pattern. This pattern helps traders and investors identify buying opportunities in the market. If used correctly, it can help in making good profits.
By Amit Pandey8 months ago in Education
Innovation and Adaptability in Action: How to Thrive in a Fast-Changing World
The modern world changes fast. New tools, new ideas, and new challenges appear every day. People and organizations must respond with speed and purpose. This is why innovation and adaptability matter more than ever. These skills help individuals, teams, and businesses stay strong during change. They support growth, learning, and long-term success. When change feels constant, the right mindset can turn risk into opportunity. Innovation and adaptability are not abstract ideas. They are daily actions. They guide how we solve problems, learn new skills, and adjust plans. They help us move forward when old ways no longer work. In a world shaped by technology, climate issues, and social shifts, these qualities are essential.
By Brian Ferdinand2 days ago in Education
Autonomy Is The Real Privilege
Good morning, freedom-seekers! Today we’re gonna be looking at autonomy. A strange word, I know; one many would probably look at blankly and run away from on sight. We’re gonna figure out what it actually means, consider how it’s achieved, and decipher just how deeply most of us are tangled up in dependence without realising it.
By That ‘Freedom’ Guy4 days ago in Humans


Comments
There are no comments for this story
Be the first to respond and start the conversation.