
ER Diagram for University Database in DBMS
Crafting an Efficient ER Diagram for a University

In the realm of Database Management Systems (DBMS), Entity-Relationship (ER) diagrams play a crucial role in modeling the structure and relationships of data within an organization. For a university, an ER diagram serves as a blueprint for the database, capturing essential entities such as students, courses, and faculty, and the relationships between them. This article will explore the components and construction of an ER diagram for a university database.
Components of the ER Diagram
An ER diagram consists of entities, attributes, and relationships:
- Entities:
These are objects or concepts that can have data stored about them. For a university, common entities include:
Student: Represents each student in the university.
Course: Represents each course offered by the university.
Instructor: Represents each faculty member.
Department: Represents each academic department within the university.
Classroom: Represents physical or virtual locations where classes are held.
- Attributes:
These are properties or details about the entities.
Student: StudentID, Name, DateOfBirth, Address, Email, PhoneNumber.
Course: CourseID, CourseName, Credits, DepartmentID.
Instructor: InstructorID, Name, Email, OfficePhone, DepartmentID.
Department: DepartmentID, DepartmentName.
Classroom: ClassroomID, Location, Capacity.
- Relationships:
These illustrate how entities interact with each other.
Enrollment: A relationship between Students and Courses, indicating which students are enrolled in which courses.
Teaches: A relationship between Instructors and Courses, indicating which instructors teach which courses.
Assignment: A relationship between Departments and Courses, indicating which department offers which courses.
Allocation: A relationship between Courses and Classrooms, indicating where each course is held.
Constructing the ER Diagram
1. Identifying Entities and Attributes
The first step is to identify the primary entities and their attributes. For our university database, we can list the entities and associate relevant attributes as described above.
2. Defining Relationships
Next, we define how these entities relate to each other. Here’s a summary:
Enrollment: A student can enroll in multiple courses, and each course can have multiple students. This is a many-to-many relationship.
Teaches: An instructor can teach multiple courses, but each course is taught by one instructor. This is a one-to-many relationship.
Assignment: Each course belongs to one department, and a department can offer multiple courses. This is a one-to-many relationship.
Allocation: Each course can be held in multiple classrooms over time, but each classroom can host multiple courses. This can be a many-to-many relationship if considering different time slots.
3. Creating the Diagram
Using standard ER diagram notation:
Rectangles represent entities.
Ovals represent attributes.
Diamonds represent relationships.
Lines connect attributes to entities and entities to relationships.
Here’s a textual representation of our ER diagram structure:
Student: (StudentID, Name, DateOfBirth, Address, Email, PhoneNumber)
Course: (CourseID, CourseName, Credits, DepartmentID)
Instructor: (InstructorID, Name, Email, OfficePhone, DepartmentID)
Department: (DepartmentID, DepartmentName)
Classroom: (ClassroomID, Location, Capacity)
Enrollment: Student ↔ Course (many-to-many)
Teaches: Instructor → Course (one-to-many)
Assignment: Department → Course (one-to-many)
Allocation: Course ↔ Classroom (many-to-many)
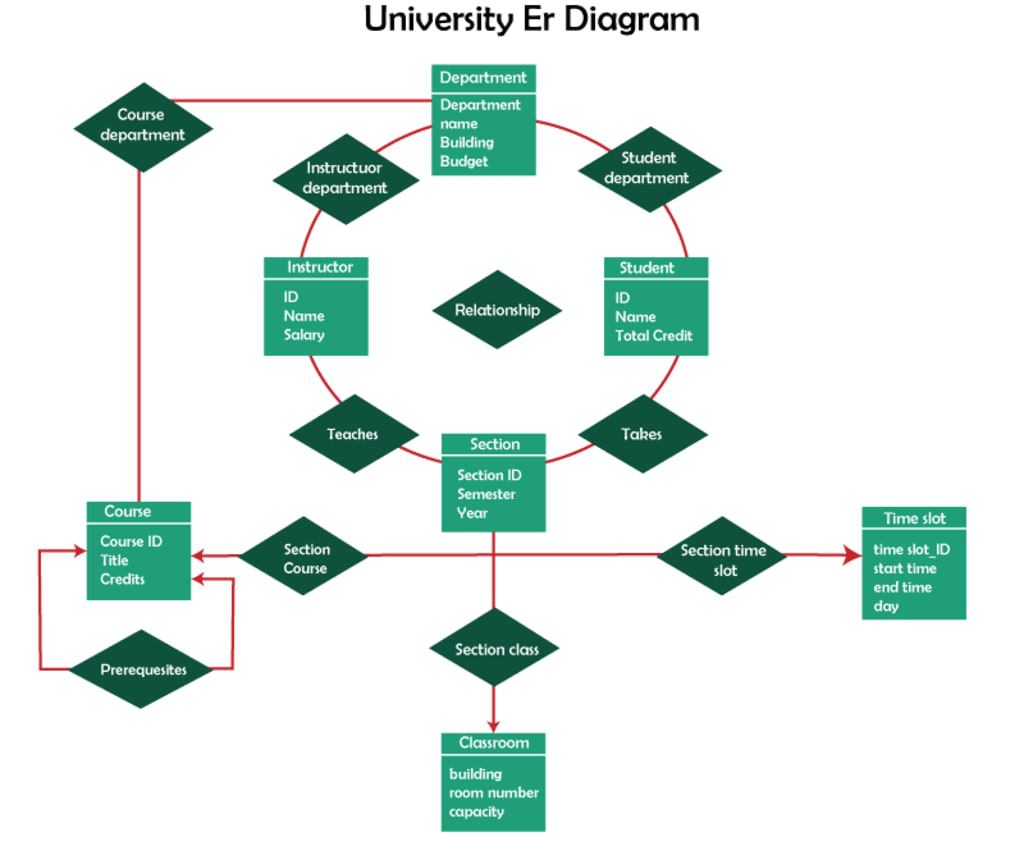
Example ER Diagram
Below is a simplified visual representation of the ER diagram for the university database:
+-------------+ +---------------+
| Student | | Course |
+-------------+ +---------------+
| StudentID |------| CourseID |
| Name | | CourseName |
| DateOfBirth | | Credits |
| Address | +---------------+
| Email | |
| PhoneNumber | |
+-------------+ |
| |
| |
EnrollsIn OfferedBy
| |
+---------------+ +----------------+
| Enrollment |-----| Department |
+---------------+ +----------------+
| StudentID | | DepartmentID |
| CourseID | | DepartmentName |
+---------------+ +----------------+
Conclusion
The ER diagram for a University database in DBMS provides a clear and organized way to visualize the complex relationships between different entities within the university. By outlining entities such as students, courses, instructors, departments, and classrooms, and their interrelationships, an ER diagram facilitates the creation of a robust and efficient database system that can effectively manage the vast amounts of data generated by a university.
About the Creator
Pushpendra Sharma
I am currently working as Digital Marketing Executive in Tutorials and Examples.
Keep reading
More stories from Pushpendra Sharma and writers in Education and other communities.
what is queue in C?
Understanding Queues in C: An Overview In the realm of computer science and data structures, a queue is a widely used linear data structure that follows a particular order in which operations are performed. The order is First In, First Out (FIFO). This means that the first element added to the queue will be the first one to be removed. Queues are essential for various applications such as scheduling processes in operating systems, handling requests in web servers, and managing tasks in real-time systems.
By Pushpendra Sharma2 years ago in Education
Communicating with Confidence: Building Trust Through Simplicity
Trust is the cornerstone of any meaningful relationship, whether professional or personal. At the heart of trust lies the ability to communicate clearly. People naturally respond to straightforward, reliable, and easy-to-understand information. Professionals who prioritize clarity establish credibility and foster confidence in others. Clients, colleagues, and partners feel assured that they can make informed decisions when the messages they receive are transparent and well-articulated.
By Stacey Yim8 days ago in Education
The One Lighting Move That Instantly Makes Your Photos Look Better
Photography advice often focuses on complex settings, advanced editing, or buying better equipment. While those things can help, they often distract from something far more powerful and immediate. One simple lighting habit can dramatically improve almost every photo you take, whether you’re shooting with a phone or a professional camera.
By Kelln Small3 days ago in Education


Comments (1)
It is mind blowing.