
Comprehensive Analysis of the NHS Referral to Treatment (RTT) Dataset in SAS
Healthcare

Introduction
This report driven by patient-centric analytics of SAS critically evaluates the NHS Referral to Treatment (RTT) dataset answering vital questions posed by the hospital managers. The goal is decoding referral patterns, the analysis of waiting times across specialties and locations, to recommend data-driven strategies aimed at enhancing patient satisfaction. Overall, the report emphasizes a role of perceptive analysis in healthcare dynamics, useful to draw some perceptions in relation to operational planning and patient care. From it, three pivotal questions zoom in on referral volume trends, specialties, and locations with extended waiting times, avenues for revolutionizing patient satisfaction founded on insights from driven data. The report essentially converts raw data into information ready actionable decision making, protecting the managers' interests of the hospital in improved health delivery, optimization of goals and overall patient satisfaction.
Analytics Design
In the design of the comprehensive analysis of the NHS Referral to Treatment (RTT) dataset in SAS, a lot of caution was used to ensure its accuracy as well as relevance. In this regard, the preliminary procedures involved the importation of the data with the use of SAS OnDemand for Academics software from the file 'data_file_cleaned2.xls'. This critical phase laid foundation to further comprehensive analysis and interpretation of the data.
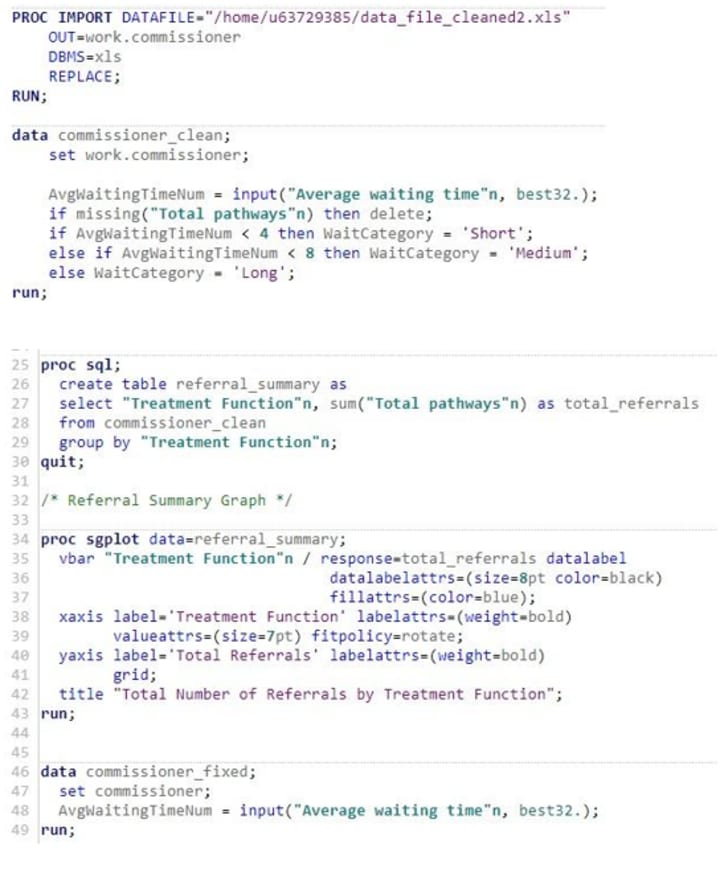
Data Importation, Cleaning and Variable Transformation
Code Snippet 1
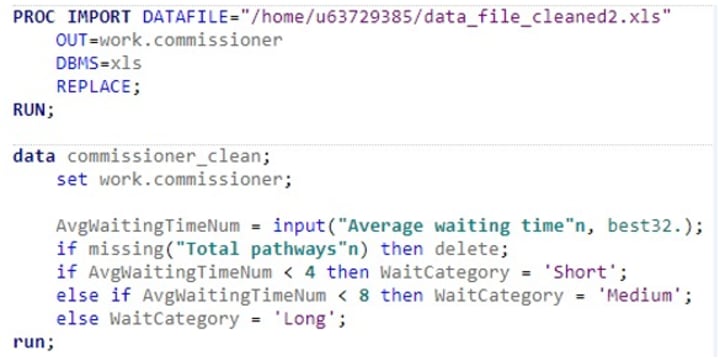
The analysis began with the importation of data into a SAS environment using the PROC IMPORT procedure. The existing data on an Excel file was converted into 'commissioner' dataset, which is for the use in subsequent analysis procedures. This-step took place after all the necessary conversions had been made and it was particularly meant to ensure that data-integrity as well as reliability is well catered for all through the entire analytic process.
Following data importation, the focus was placed on cleaning and transforming the dataset. Data quality was maintained through variables such as missing values handling and variable conversion techniques among others. New variables, for example, 'WaitCategory,' were created to aid in easier comprehension and also preparing the dataset for even more superior analyses.
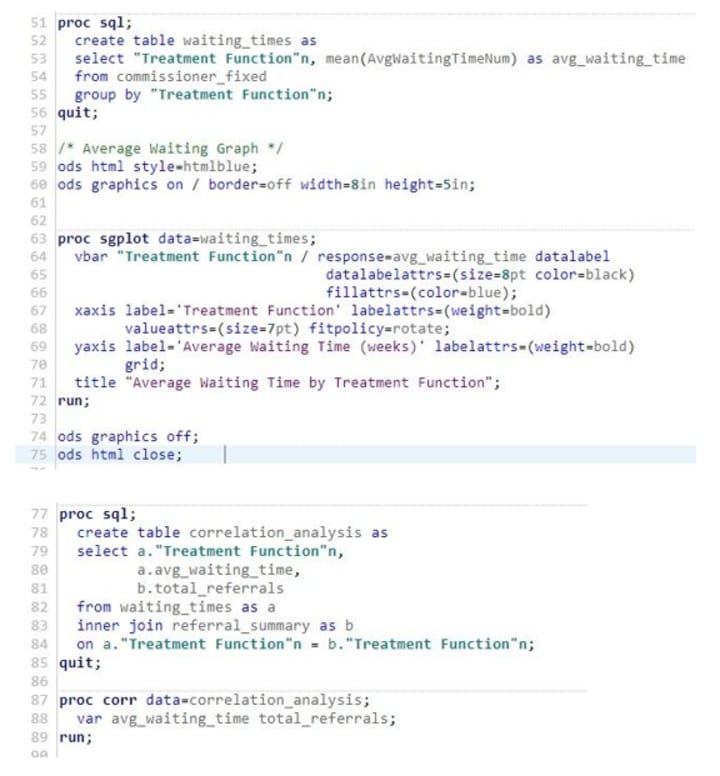
Referral Summary and Graph Analysis
Code Snippet 2

Analysis continued with the development of a statistical graph referred to as 'referral_summary' with rows carrying the parameters 'Treatment Function,' and columns carrying dates to summarize the total of referrals. This catered for stakeholder questions in regards to referral volumes over time giving actions of the historical trends that had been followed and hence could be used as a guide when looking at the future perspective.
Average Waiting Times Analysis and Graph
Code Snippet 3
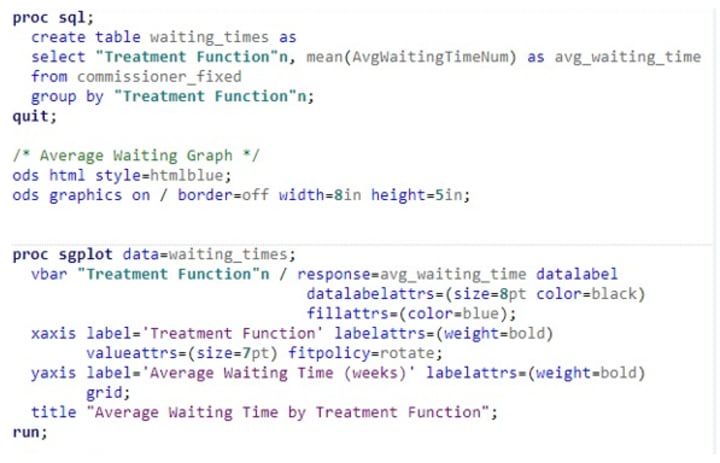
Using 'commissioner' dataset, average waiting times for each function of treatment were calculated and placed in the 'waiting_times' table. This way, the analytical data rendered visualization or graphical display for decision-making as different bars on the graph showed average waiting times in different functions. Consequently, whichever areas having longer or shorter waiting times, could address any concerns based on treatment area.
Correlation Analysis
Code Snippet 4
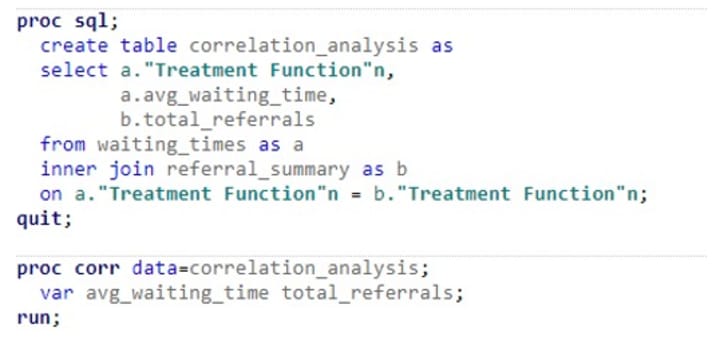
Further analytical steps entailed carrying out correlation analysis between average waiting time and total referrals. The 'correlation_analysis' table created, was applied to the PROC CORR procedure with the intention of finding out possible relationships between waiting times and referral volumes.
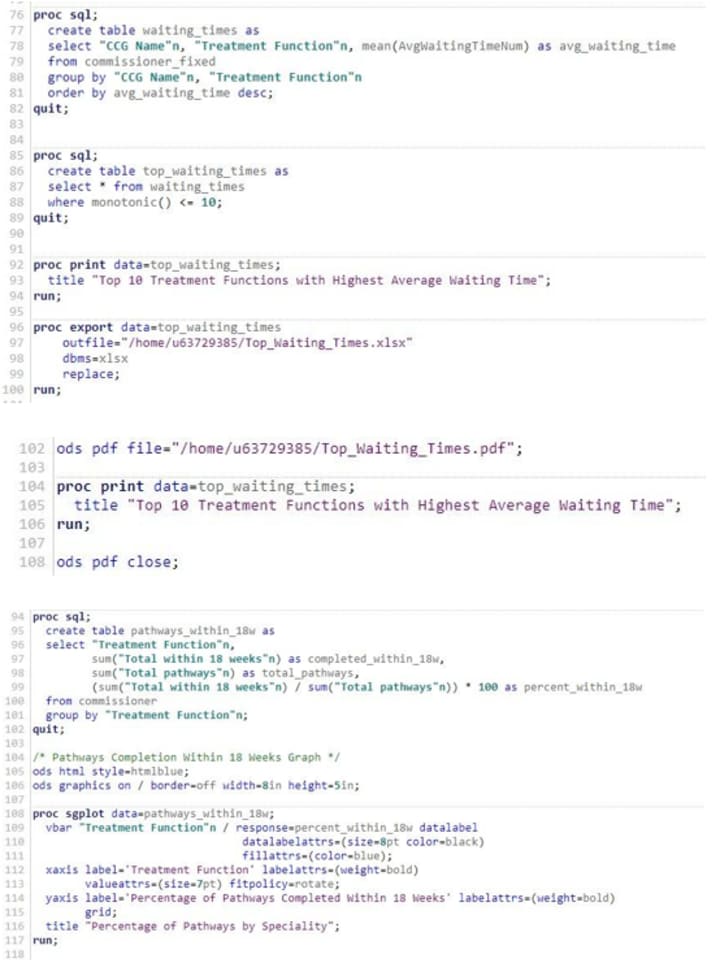
Top Average Waiting Times Table
Code Snippet 5a
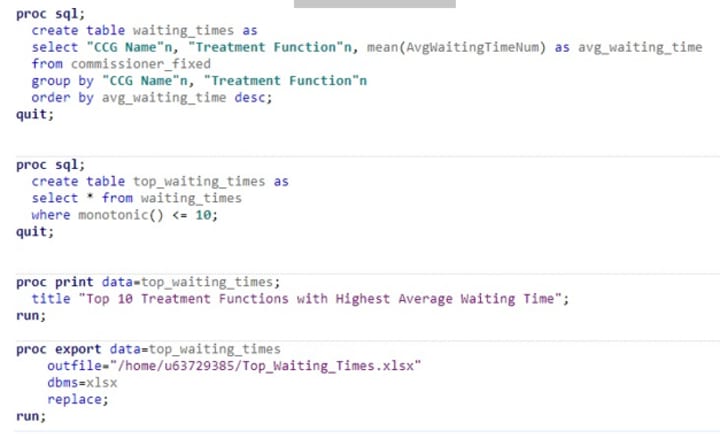
Code Snippet 5b
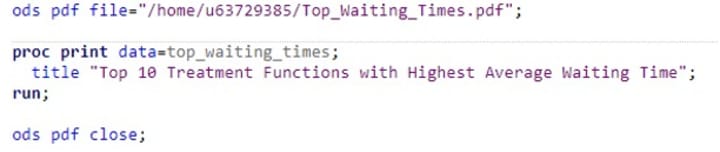
Top average waiting times table analysis aimed to identify and place focus on the top treatment functions with the highest average waiting times in the final stages of the analysis. This process involved creating a table, organizing in descending order of the average waiting times and then selecting the top 10 treatment functions, and finally printing the results. This analysis aimed to enable the stakeholders to quickly identify and focus on the statistics.
Pathways Completion Within 18 WeeksCode
Code Snippet 6
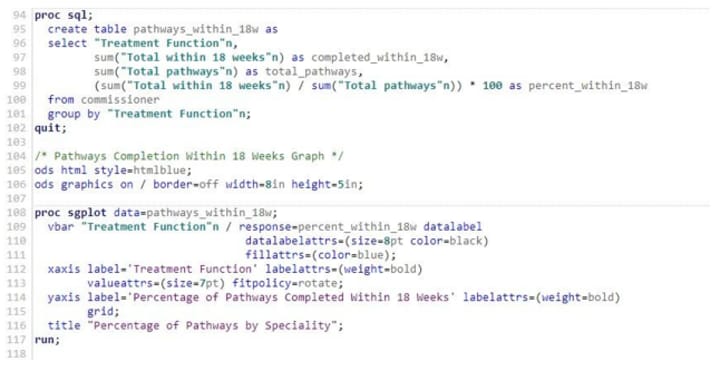
This component of the analytics design involved in creating a graphical representation to display the percentages of pathways completed within 18 weeks in regard to treatment. This can be used to improve strategic interventions with a perspective of ensuring that the best results are achieved in managing the well-being of patients.
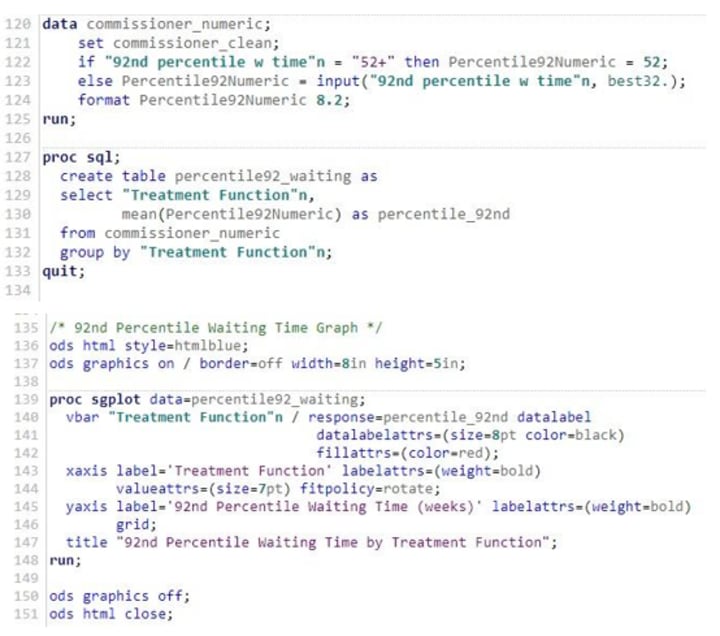
92nd Percentile Waiting Time
Code Snippet 7a
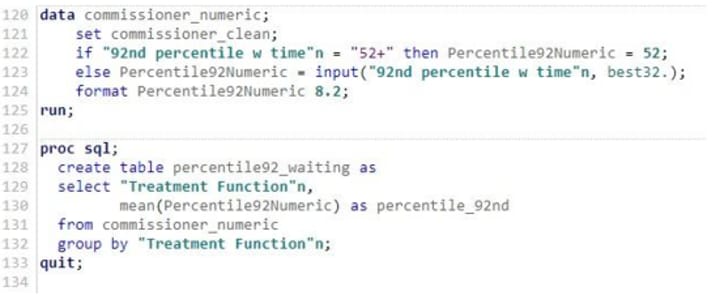
Code Snippet 7b
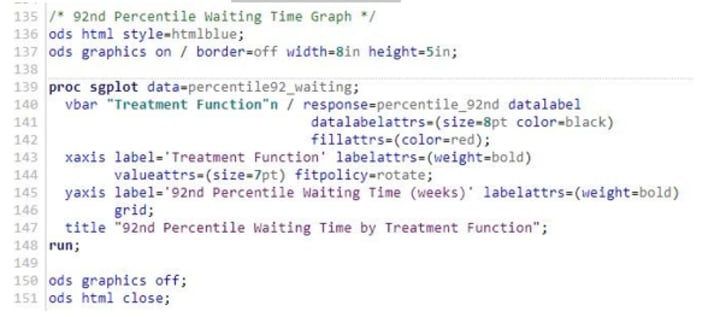
This part of the analytics design considered cleaning, relative of the 92nd percentile waiting time, converting it to numerical values, thereafter developing a graph on this and eventually visualizing mean of 92 percentile waiting time against treatment functions.
Closing Analysis and Visualization
Code Snippet 8

This stage involved turning off graphics for HTML output, ensuring the proper closure and completion of the SAS code. This indicated that all necessary graphical visualizations had been executed.
In this whole process, the methods and techniques employed were in line with the analytical objectives, translating the data collected into a coherent story. The final report is not just a congregation of data and graphs but a complete story which gives explicit answers to questions asked by stakeholders.
The Story
This chapter explores complex dynamics in healthcare service delivery with analysis of referral volumes and waiting times extracted from the NHS RTT dataset. The low correlation questions assumptions and unveils factors beyond referral numbers influencing waiting times. Figures depicted complexities in patient flow, spotlight disparities in specialties and areas. On further dedication section explores the 92nd Percentile Waiting Time, uncovering the extremes, and Specialties with extended waiting periods. Moving forward, completion rates dissected in various specialties. These data-driven insights frame a roadmap to enhance patient satisfaction and prompt the providers to seek multi-faceted variables in optimizing their reach of operational efficiency.
Trends in Referral Volumes
The NHS Referral to Treatment (RTT) dataset, which is supported by SAS analytical tools, records details of healthcare operations that defy common beliefs and recommendations on strategic changes required.
Figure 1: Total Number of Referrals by Treatment Function
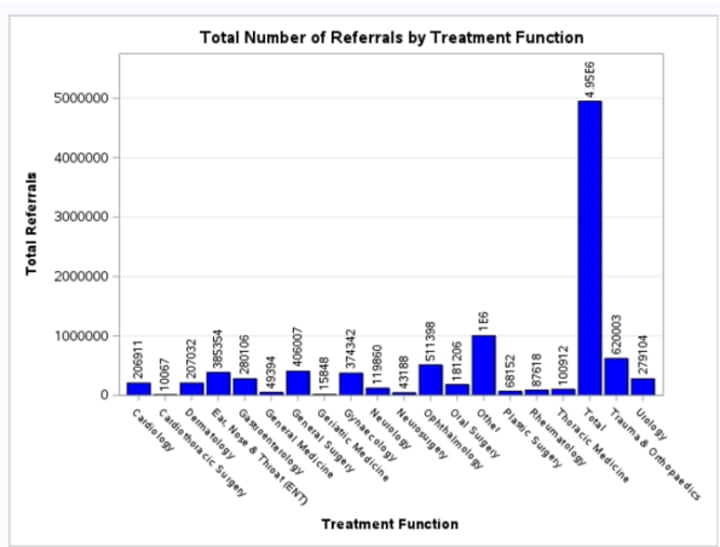
The examination of total referrals by treatment function (figure 1) provides an overall understanding of the demand. Of all the specialties, ENT and Ophthalmology clearly lead in referrals in a rather high demand between them. Ear, Nose & Throat, with a high number of cases which it can be inferred may have longer waiting times, may have potential capacity constraints. Trauma & Orthopaedics, located lower with regards to referral number, shows extremely high waiting times raising questions about its complexity and resource requirements. This sharp contrast disputes the assumption that only volume effect waiting times, stressing other factors of operational influence (Åhlin et al., 2023; McIntyre & Chow, 2020; Bravo et al., 2021).
Figure 2: Average Waiting Time by Treatment Function
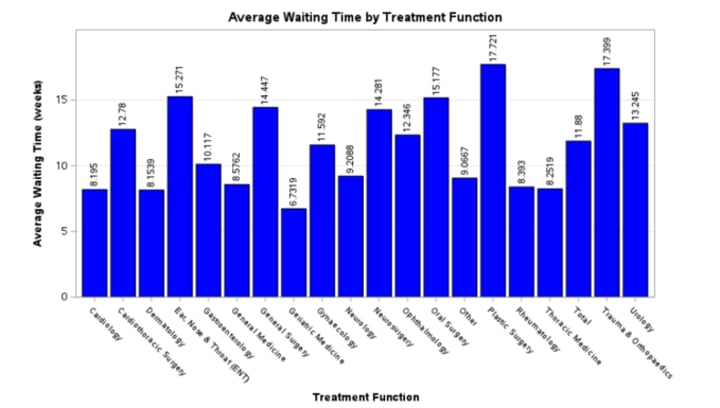
The graph above (figure 2) constituting average waiting times manifests considerable disparities among specialties. Plastic Surgery, Trauma & Orthopaedics and ENT show significantly longer waiting times, in particular Plastic Surgery at 17.712 weeks. This may indicate possible inefficiencies with respect to patient flow or resource usage. Inversely, Geriatric Medicine and Rheumatology show shorter waiting times than average, indicating well-managed pathways or lower demand. This shows specific bottlenecks in the system, directing focused enhancements in allocating resources and process optimization (Åhlin et al., 2023; McIntyre & Chow, 2020; Bravo et al., 2021).
Figure 3: Variability in Waiting Times by Treatment Function
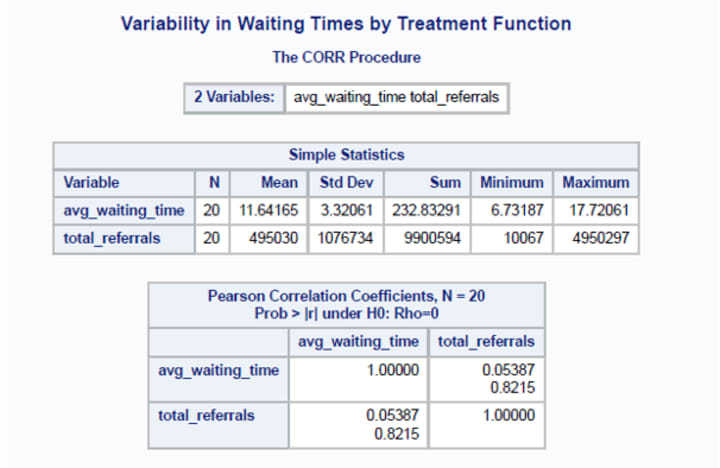
The statistical analysis (figure 3) insists on the presence of negligible positive correlation (0.05387) between average waiting times and total referrals. This refutes the assumption that higher referrals solely on their own, are directly proportionate to increased more waiting periods, signifying role of other possible factors. An overall analysis shows that indeed the referral volume may not be the main directional factor of how much waiting times would be. Such a weak correlation points towards a closer analysis of endeavors where validity processes and resource allocations endeavor to be determined by case complexity as well as operational efficacy ((Bayliss et al., 2008; Gualandi et al., 2019).
92nd Percentile Waiting Time Analysis
Figure 4: 92nd Percentile Waiting Time by Treatment Function

92nd Percentile Waiting Time (figure 4) is the maximum waiting times representation within each specialty as it reveals long waiting times. Oral Surgery involves the specialties with highest waiting times, in excess of 50 weeks, followed by Plastic Surgery and instead Trauma & Orthopaedics as the third longest specialty. Such specialties where waiting times are significantly long generally require targeted interventions because they present the biggest risks to both the patient outcomes and satisfaction. Conversely, specialties like Geriatric Medicine, Cardiology, and General Medicine have lower 92nd percentile waiting times ensuring that even patients some at the higher end of the waiting spectrum receive faster attention in contrast to other specialties.
Specialties and Locations with Long Waiting Times
Figure 5: Top 10 Treatment Functions with Location (CCG) with Respect to Highest Average Waiting Time
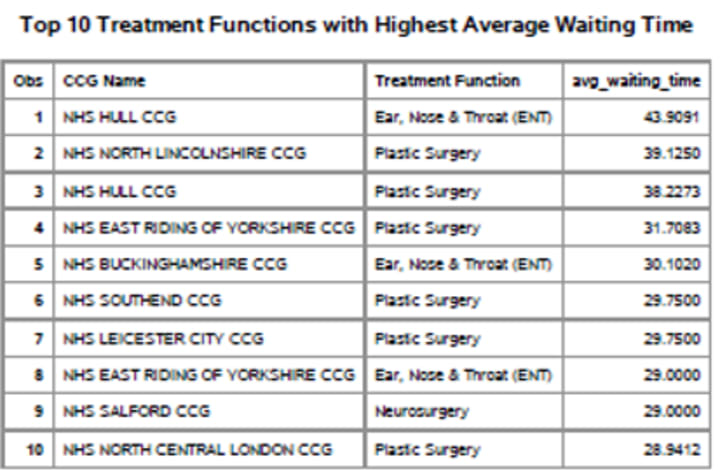
The table (figure 5) above describes informatively the current landscape of specialty and location areas of extended waiting periods of wait. 'Ear, Nose & Throat (ENT)' and 'Plastic Surgery' are notably the two kinds of specialties where patients are put on long waiting times as is shown in the data provided. Most strikingly perhaps, ENT experience the longest average wait time with NHS Hull CCG at approximately 43.91 weeks. Plastic Surgery appears similarly, illustrating extended period of average Waiting time of around 39.13 and 38.23 weeks in both NHS North Lincolnshire CCG and NHS Hull CCG.
It is vital to understand that these aren't isolated problems, as the figures are representative of a trend spreading across a number of Clinical Commissioning Groups. For example, Plastic Surgery at NHS East Riding of Yorkshire CCG and NHS Southend CCG both have inordinate waiting times averaging in excess of 31 and 29 weeks respectively. This trend points to some challenge in the system of the specialties and needs an immediate and a strategic intervention in order to improve service delivery.
Figure 6: Percentage of Pathways by Specialty

Moving on to the completion rates, Geriatric Medicine performs extremely well with more than 81% of pathways being completed within 18 weeks, depicting the best patient flow. On the other hand, Cardiology and General Medicine also showing higher completion rates, which depict having become proactive in respect of management of the patients' flow. Conversely, less than 48% completion was signaled for Trauma & Orthopaedics trails, pointing to the significant delays and need for improvement. ENT, General Surgery, and Plastic Surgery hover around a 50% completion rate serve to signal that almost half of patients in these specialties aren't being treated within the targeted timeframe.
Improving Patient Satisfaction
These data-driven insights open up vast opportunities for enhancing patient satisfaction apart from rendering a better overall experience within healthcare, in particular regarding referral volumes and waiting times. The low correlation (r = 0.05387) from figure 3, between the average waiting times and total referrals is significant because it would indicate that other variables other than the referral count accounted for significant variances in the waiting times. This understanding will be important to healthcare providers who desire to improve customer experiences through strategic measurable changes.
Acknowledging that waiting times are driven by other factors besides purely referral volumes does support providers to explore these components such as resource allocation, staffing levels, and operational efficiencies. That ensures that proactively managed patient flow allows for these aspects, guaranteeing that there is minimal wastage of time while improving the experience that patients have (Åhlin et al., 2023; McIntyre & Chow, 2020; Bravo et al., 2021).
It is vital that when such referrals occur, the complexity in helping identify whether longer waiting time arises from higher proportion of complex cases which require specialized care (Bayliss et al., 2008). Especially, adapting patient flow management to case complexity enhances efficiency both in satisfied simple and complex cases (Gualandi et al., 2019).
If the numerous variations caused by external factors, such as seasonality and threats to public health, have been factored in, then it can be made possible to predict them and even control the volumes of referrals. Being prepared in advance to tackle the variations keeps the waiting times constant thereby avoiding sudden surges (Fares, 2013; Akbari-Sari et al., 2021).
After identifying several specialties and Clinical Commissioning Groups (CCGs), data analysis identifies the significant information to understand the CCGs that had longer waiting times. Resource allocation targeting or focused intervention on such areas, quality improvement initiatives, or process reengineering improve the patient experiences in such high demand areas by a large margin (Naiker et al., 2018; Bastemeijer et al., 2019).
Conclusion
In conclusion, this report, enabled by the power of analytics from SAS, offers a complete study of the NHS Referral to Treatment (RTT) dataset challenging common assumptions with low correlation (r = 0.05387) linking incremental referral volumes to average waiting times. It makes clear the need to continually investigate aspects beyond referral numbers, pinpointing those specialties and locations with prolonged waiting times guiding strategic interventions. Analysis of Waiting Time at 92nd Percentile highlights extremes, that can help target intervention for specialties with substantial risks to patient outcomes. Moreover, completion rates highlight exemplary performances in Geriatric Medicine, Cardiology and General Medicine detailing multi-faceted approaches in improved patient flow. Through this report, both the considerations of resource allocation and staffing levels to enhance efficiency and raise patients' satisfaction are embedded as potential process reengineering alongside targeted interventions. Overall, it turns raw data into actionable insights guiding health care providers on enhancing service delivery and achieve optimally the patient's satisfaction.
Bibliography
Åhlin, P., Almström, P., & Wänström, C. (2023). Solutions for improved hospital-wide patient flows – a qualitative interview study of leading healthcare providers. BMC Health Services Research.
Akbari-Sari, A., Seyed-Nezhad, M., & Ahmadi, B. (2021). Factors affecting the successful implementation of the referral system: A scoping review. Journal of Family Medicine and Primary Care.
Bastemeijer, C. M., Boosman, H., van Ewijk, H., de Jong-Verweij, L. M., Voogt, L., & Hazelzet, J. (2019). Patient experiences: a systematic review of quality improvement interventions in a hospital setting. Patient Related Outcome Measures.
Bayliss, E. A., Edwards, A. E., Steiner, J. F., & Main, D. S. (2008). Processes of care desired by elderly patients with multimorbidities. Family Practice.
Bravo, F., Braun, M., Farias, V., Levi, R., Lynch, C., Tumolo, J., & Whyte, R. (2021). Optimization-driven framework to understand health care network costs and resource allocation. Health Care Management Science.
Fares, A. (2013). Factors Influencing the Seasonal Patterns of Infectious Diseases. PubMed Central (PMC).
Gualandi, R., Masella, C., & Tartaglini, D. (2019). Improving hospital patient flow: a systematic review.
McIntyre, D., & Chow, C. K. (2020). Waiting Time as an Indicator for Health Services Under Strain: A Narrative Review. INQUIRY: The Journal of Health Care Organization, Provision, and Financing.
Naiker, U., FitzGerald, G., Dulhunty, J. M., & Rosemann, M. (2018). Time to wait: a systematic review of strategies that affect out-patient waiting times. Australian Health Review.
Appendix
Important Notes:
This report, driven by patient-centric analytics of SAS, critically evaluates the NHS Referral to Treatment (RTT) dataset, answering vital questions posed by the hospital managers. It essentially converts raw data into information ready for actionable decision making, protecting the managers' interests of the hospital in improved health delivery, optimisation of goals and overall patient satisfaction.
A well-written health care assignment for a UK University requires a deep understanding of various aspects of health care and good writing skills. If you are struggling with writing your assignment, consider seeking online university assignment help from a professional assignment help UK service.
If you are working on a healthcare dissertation and find difficulty in writing it as it requires advanced research methodology, don’t hesitate to seek help from a reputable online dissertation writing service UK.
About the Creator
Keep reading
More stories from Lucy Rowell and writers in Education and other communities.
Impact of Health Determinants
SUMMATIVE ASSESSMENT 2 Introduction According to Gómez et al. (2021), addressing determinants of health help to reduce longstanding inequalities in health and make significant progress towards promoting health equity at individual as well as community basis. It reflects that determining how each determinant of health can affect health and wellbeing of an individual and community is essential for developing policies and interventions that help to address those determinants and improve health and wellbeing of individuals and communities. Considering this, the aim of this essay is to discuss and evaluate the impact of health determinants, including biological, social, and environmental on individual as well as community health through using relevant facts, statistics, and examples.
By Lucy Rowell7 months ago in Education
The Discipline Line That Protects Every Serious Trader
A lack of opportunity rarely destroys long-term trading success. A single uncontrolled loss far more often destroys it. Markets move quickly, emotions react faster, and hesitation at the wrong moment can erase months or years of progress. Pre-defined stop losses are in place to prevent that outcome.
By Agast Mishra4 days ago in Education
The Road That Taught Him Silence
In the small village where the mountains met the fields, mornings arrived quietly. The sun did not rise in a hurry there; it climbed slowly, as if respecting the stillness of the land. Birds were the first to greet the light, their soft calls weaving through the narrow lanes and mud-brick houses. Aamir had learned to wake before the village did. At first, this habit was forced. Sleepless nights, heavy thoughts, and restless dreams had pushed him out of bed before dawn. He did not know where to go, only that staying inside the house made his chest feel tighter, his breath shorter, his mind louder. One morning, without purpose, he stepped outside and began walking toward the path that lay between the barley fields and the low, blue mountains. That path soon became his silent companion. Every day, he walked there — sometimes quickly, sometimes slowly, sometimes stopping for long minutes to watch the wind bend the crops like a green ocean. The path was narrow and uneven, yet it carried him faithfully, never asking where he was going or why. In its quiet presence, he found a strange comfort. Aamir was not unhappy in the usual sense. He had food, family, and education. He taught children in the village school and was respected by many. Yet inside him lived a deep confusion — a soft but constant question: Am I becoming what I was meant to become? He had dreams once — of writing, of speaking beautifully, of guiding others not only through lessons but through life itself. But responsibilities had grown faster than courage. Slowly, without noticing, he had begun to doubt himself. And doubt, unlike pain, does not shout. It whispers. On one such morning, when the mist still clung to the fields like a thin veil, Aamir noticed footprints beside his own. They were not fresh, but they were regular — the marks of someone who walked the same road every day. A few minutes later, he found their owner. An old man sat on a flat stone near the edge of the path, a wooden staff resting beside him, a small flock of sheep grazing quietly nearby. His beard was silver, his clothes simple, and his eyes clear in a way that surprised Aamir. Those eyes did not seem tired by age; they seemed polished by time. “Peace be upon you,” Aamir greeted. “And upon you, peace,” the old man replied warmly. “You walk early.” “So do you,” Aamir smiled. The old man nodded. “The morning is honest. It shows you who you are before the world begins to tell you who you should be.” The words struck Aamir gently, like a leaf touching water. From that day onward, they met often. Sometimes they spoke, sometimes they shared long silences. The old man never asked many questions, yet somehow Aamir found himself speaking — about his students, his ambitions, his fear of wasting his abilities, his constant comparison with others who seemed more confident, more successful, more certain. One morning, Aamir confessed, “I feel as if I am standing still while the world moves ahead.” The old man watched the sheep for a moment, then said, “Have you seen a tree grow?” “Yes.” “Does it run to become tall?” “No.” “Yet it becomes tall.” Aamir smiled faintly. “But people judge trees by their height.” “They do,” the old man agreed. “But trees are not planted to impress people. They are planted to become themselves.” The sentence stayed with Aamir long after the walk ended. Days turned into weeks, and weeks into months. With each walk, something inside him shifted — slowly, almost invisibly. He began to notice small beauties he had ignored before: the way dew rested on grass like tiny mirrors, the rhythm of his own breathing, the calm dignity of the mountains that never hurried yet never failed to stand firm. One morning, Aamir arrived to find the stone empty. No sheep. No staff. No silver-bearded teacher. For several days, he returned at the same hour, hoping to meet the old man again. But the path remained silent, as if it had never known such a presence. Disappointment crept into his heart. On the seventh morning, as he walked farther than usual, he noticed a small bundle placed carefully beside the path. Inside it lay a worn notebook and a folded piece of paper. The note read: “To the one who walks with questions, Do not search for me again. I was only a mirror, not a guide. The road has taught you silence. Silence has taught you clarity. Now let clarity teach you courage. Remember: You are not late. You are not lost. You are simply growing underground.” Aamir sat there for a long time, holding the paper with trembling hands. That day, when he returned home, he opened his old notebooks, the ones where unfinished writings slept like forgotten seeds. For the first time in years, he wrote not to impress, not to compete, but to understand himself. He began to speak more gently to his students, not only teaching lessons, but listening to fears. He encouraged them to walk, to observe, to think, to trust their own pace. And every morning, he still walked the same path. The road never answered his questions directly. But slowly, quietly, it returned something far more precious: The belief that becoming oneself is not a race — It is a journey best taken in silence, With steady steps, And an honest heart.
By Muhammad yaseen3 days ago in Education


Comments
There are no comments for this story
Be the first to respond and start the conversation.