
BREAKING: Fake News Leads To Fake Science
How the internet plays a crucial role in the fast spreading of misinformation and the paranoia it creates in a post COVID-19 world


A Deeper Look Into Fake News As It Relates To Epidemiology
In my recent studies, a huge topic of discussion among my colleagues is the importance of fake news versus real news. This is a huge issue in the field of epidemiology as it leads people to believe in misinformation. Commonly fake news is used by professionals to sell their product to the general public. This is done by the use of skewed news that does not display an accurate representation of its population. An example of this that I have studied is the concept of causal inference and ecological fallacy, and looked at the relationship of how the consumption of chocolate and winning the Nobel prize was “correlated”. Obviously this is not the case and is related to other factors such as their overall consumption of chocolate as well as their possibility of being a large manufacturer of chocolate (ex. Switzerland). This concept peaked my interest, and I wondered, how many other sources of fake news in current healthcare topics have we fed into? I will be using the COVID-19 pandemic to look deeper into this topic and the importance of discrete statistics for the proper identification of health risks.
Discrete Statistics In Epidemiology
Disease is not continuous but discrete. This means our typical statistical analysis (ex. mean, median and mode) would not suffice when looking at disease. This calls for a whole new set of statistical calculations to understand the behavior of disease. The main calculations I've focused on are odds, prevalence, cumulative incidence and incidence rate.
The Importance Of Proper Statistical Analysis
While I was researching the use of proper statistical analysis for the accurate prediction of COVID-19 outcomes and side effects, I came across a study that used incidence rate to analyze infection of COVID-19 in hemoglobinopathies (Haghpanah et al., 2021). Hemoglobinopathies are a collection of disorders that are of sickle cell disease. If an individual has this hereditary disease, then it means they produce too much hemoglobin. With the incidence rate calculation as well as a mortality rate observation, they could conclude that there is a slight correlation between people with this disease getting COVID-19 more readily when compared to the general population as well as getting the virus worse. This led them to conclude that receiving the vaccine was crucial for these individuals to keep them protected. Since they used incidence rate to analyze this information, an accurate correlation has been made. During the pandemic however, this was not always the case.
COVID-19 Fake News Example
One of the largest debates of recent times is that vaccines have a direct correlation to causing autism. This has been debated and argued for years and years with the development of modern medicine, and the issuing of more vaccines over the years. This “outbreak” of mass paranoia started in 1998, after a man named Andrew Wakefield published a paper which associated immunizations with autism (Carrion-Alvarez & Tijerina-Salina, 2020). Since this time parents have started to opt out and not immunize their children due to this fear, and the debate has come back around with the spreading of COVID-19. Parents have chosen not to give their children any number of doses of the COVID-19 vaccines, as they deem it unsafe. The fact of the matter is, they have been consumers of fake news which has led them astray.
One of the main contributors during the pandemic to the spreading of fake news was the internet. Everyone had the internet so readily available to them, and it was the only thing everyone was on for months. The problem with platforms like Youtube and Instagram is that anyone can post to them. There is no credential to post an article and or video on the topic, and anyone can view them. People on the internet tend to use statistics that are properly adjusted. This can include and is not limited to:
- Population adjustment
- Age adjustment
- Consideration of other health factors
- Consideration of environmental factors
This means that individuals used basic continuous statistics that should not be used when discussing disease, especially in the case of a pandemic. This led people from all around the world to become confused and not trust in science, as they didn't know who to believe. In Europe, during the pandemic a survey was conducted and 10% of France and Germany said they would not accept a vaccine. Later into the pandemic as it worsened, 28% of France said they were unsure about receiving the vaccine (Carrion-Alvarez & Tijerina-Salina, 2020). This uncertainty people felt was due to the mass spread of misinformation and the neglect of correct scientific analysis.
Too Many Graphs Equal Too Much Panic
The amount of statistics being conducted due to the pandemic caused an overflow of graphs being generated. When I searched “Highest Number of COVID-19 cases globally” into google, I was met with the following graph:
Table 1: Graph Depicting Number Of COVID-19 Tests
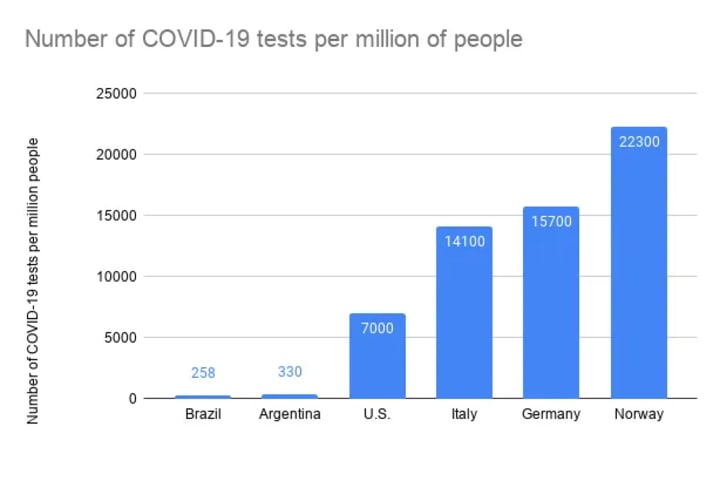
This graph was one of the first graphs to appear in my search. The general viewer of this graph who is overcome with panic from the pandemic may look at this graph and take it at face value (Kotsehub, 2020). This means they would correlate what they searched to this graph and believe this is the number of active cases being reported of COVID-19 in the specific case listed. By reading this graph you can see it says “number of COVID-19 tests per million of people”. This means this is the number of COVID-19 tests being administered, not the number of active cases. There are lots of factors and information missing from this graph. For example, how many cases are active? What is the morbidity rate? What is the incidence rate? None of these questions are answered and none of this information is readily available to the public. This is a prime example of the media using the general public's fear and lack of attention to elicit misinformation.
Final Thoughts And Takeaways
After lots of discussions on misinformation and incorrect statistical analysis in, I researched further to learn this is a much bigger problem than I thought. There is no real way to regulate the spreading of misinformation on social media platforms and this is causing a huge problem globally. People are using inaccurate analysis techniques to predict disease outcomes and sway people away from the truth. The use of discrete statistics is very commonly ignored on social media platforms and information is manipulated in favor of the individual's argument whether right or wrong.
References
Carrion-Alvarez, D., & Tijerina-Salina, P. X. (2020). Fake news in COVID-19: A perspective. Health Promotion Perspectives, 10(4), 290–291. https://www.ncbi.nlm.nih.gov/pmc/articles/PMC7722992/
Haghpanah, S., Hosseini-Bensenjan, M., Sayadi, M., & Karimi, M. (2021). Incidence Rate of COVID-19 Infection in Hemoglobinopathies: A Systematic Review and Meta-analysis. Hemoglobin, 45(6), 371–379. https://www.tandfonline.com/doi/abs/10.1080/03630269.2021.1927751
Kotsehub, N. (2020, June 24). Stopping COVID-19 with Misleading Graphs. Medium. https://towardsdatascience.com/stopping-covid-19-with-misleading-graphs-6812a61a57c 9
About the Creator
Marisa Chiaravalloti
Hello, I am an Honours Biomedical Science student with a Minor in English curious about all things science. I am also the primary writer and researcher for the TMU Rare Diseases Club's online educational section. I hope you enjoy! 🔬
Keep reading
More stories from Marisa Chiaravalloti and writers in Education and other communities.
A Formal Analysis Of A Case-Control Study Focused On The Sleeping Behaviours Of Children Diagnosed With Smith-Magenis Syndrome (SMS)
When I was five years old my aunt had her first son. When he was born, he had a plethora of minor health issues and as he grew up, his parents and family noticed that he had behavioral differences and struggled with important aspects of life such as sleeping, cognition and health problems. My aunt brought him to the hospital frequently until they finally diagnosed him with Smith-Magenis Syndrome (SMS). Since that day they have been on the hunt for various ways he can be treated to alleviate the difficulties of the condition. When I was fourteen my sister and I held a bake sale concerning PRISMS, the foundation dedicated to furthering research on Smith-Magenis syndrome. It is an American-based foundation as there are no Smith-Magenis foundations in Canada. It is a condition that is deemed very rare, and therefore it is hard to find proper treatment and support, especially in Canada. One thing I always noticed is that my cousin does not sleep very well. He often wakes up throughout the night and won’t sleep for more than a few hours, frequently waking up every day at 5 am. I have always been curious about furthering my knowledge on the condition and ways to help my cousin, therefore I will be looking at a case-control study that looks at the sleeping habits of children diagnosed with Smith-Magenis Syndrome.
By Marisa Chiaravalloti3 years ago in Education
Creativity vs Productivity: Finding the Right Balance for Better Results
In today's fast-paced world, the pressure to produce more and achieve faster results is constant. On the other hand, creativity, often seen as the fuel for innovation and growth, requires space, reflection, and sometimes a slower pace. These two forces, creativity and productivity, are at odds with one another. But instead of choosing one over the other, the key to better results lies in finding a balance between them. When properly managed, creativity and productivity can support each other, leading to more fulfilling work and sustainable success.
By Norman Badger6 days ago in Education


Comments
There are no comments for this story
Be the first to respond and start the conversation.