
What is React Native Flipper: An Application Debugging Tool
React Native Flipper: An Application Debugging Tool

What is Flipper?
IOS, Android, and React Native apps can be debugged on the Flipper platform. It is a debugging development tool by Facebook that is open-source. Since Flipper is highly & easily extendable, there are numerous plugins available for it that we can utilize for debugging. Flipper can be used for memory leak detection, sharing preferences, content previews, examining loaded images, Hermes debugger integration, and Metro bundler integration.
Flipper makes use of remote debugging, which permits the app to function in a setting as similar to the production environment as feasible. Compared to straight debugging, it boosts your confidence when debugging apps.
Top React Native app developers point out that Flipper’s plugin library, which lets you install plugins easily from the Flipper interface and expand its capabilities, is its most significant advantage over competing debugging tools. You can develop your plugins and distribute them! But let’s get started right away.
Features of Flipper:
Flipper solely offers the architectural platform itself. The plugins created on top of it, such as Network Inspector, Layout Inspector, and Logs, make it worthwhile. Your app’s business logic and use cases can be used to build very specialized plugins. Flipper comes pre-installed with a few general-purpose plugins, but you’re encouraged to develop your own. It is necessary to enable each plugin separately.
How To Use React Native Flipper?
As I stated, Flipper integration already exists in your project if it uses React Native 0.62 or later. You only need to install Flipper to get started.
How to Setup Flipper in a React Native for App Development?
Launch the Flipper Desktop programme for Android, then start your project with yarn android. In Flipper, your application will show up.
Run pod install once in your project’s iOS directory for iOS. Launch Flipper and yarn iOS after that. In Flipper, your application will appear.
Debugging in React Native:-
There are more steps to follow to get Flipper to function with your app if you are using an older version. For iOS and Android, go to these URLs.
Crash Reporter: Crashes’ logs
Logs: Logs (which comprise logs from JavaScript and native logs without the necessity to launch Xcode or Android Studio)
Layout: Layout is the Chrome debug console’s equivalent of the Elements browser.
Network: You may browse your incoming and outgoing network requests using the network.
Shared Preferences Viewer: You can examine and modify shared preferences using the Shared Preferences Viewer.
Hermes Debugger: Android applications can be debugged with Hermes Debugger.
React DevTools: React DevTools is available as a Flipper plugin.
Using plugin management, you may browse your installed plugins and add, update, or remove any other plugins you might require if you so want.

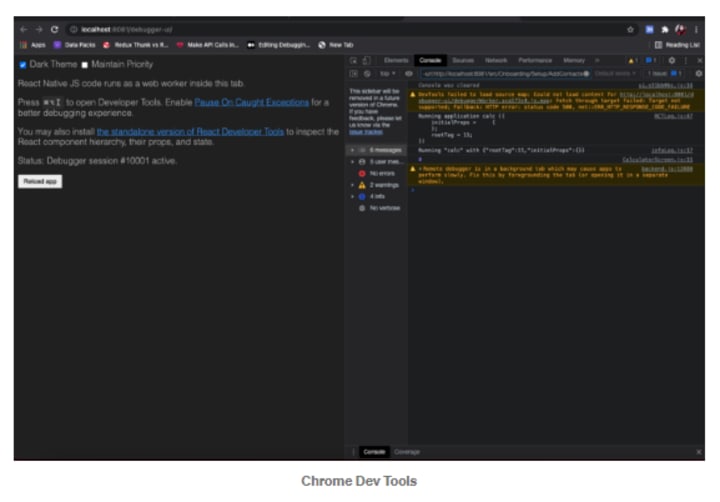
Chrome Dev Tools:
Chrome Dev Tools is a simple method for debugging any app. But to verify the status of the application, we must add console.log() to every line. Enable debug mode and examine the programme to use Chrome Dev Tools. The biggest drawback of the Chrome development tools is that network debugging is not supported.
Redux debugger:
Redux is fantastic until you make a mistake and cannot find it in the code. Redux debugging can occasionally be done with console.log, but it isn’t very easy. You typically need to log in to several different places to find out what is happening.
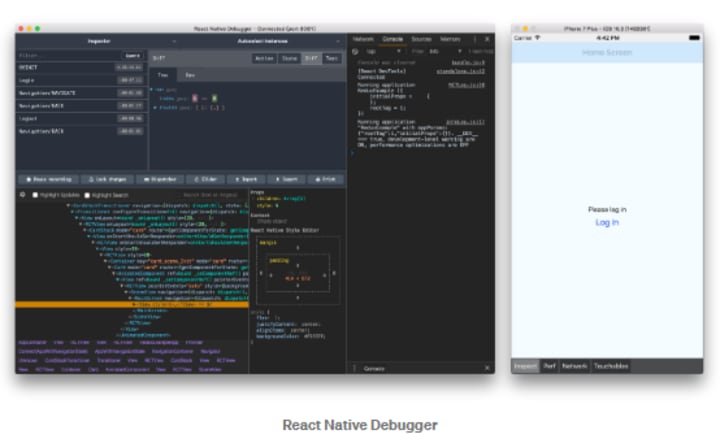
React Native Debugger:
Electron Framework was used to create the debugging technology called RN Debugger. It is a fusion of the Chrome Developer Tools, Redux Developer Tools, and React Developer Tools, all integrated into one. We can look at the layouts, props, and redux state, create breakpoints, and look at the metro logs and network requests in RN Debugger. But installing several plugins and using the emulator to debug multiple devices is challenging, and it will only work with the debug mode being turned on. A network log is present, although it has restrictions.
Flipper Plugins:
Network calls like fetch, Axios, super agent, etc., can be made with Flipper. The debug mode does not need to be enabled to debug our software. Simple to create our plugins, install, debug images, and debug various devices on emulators.
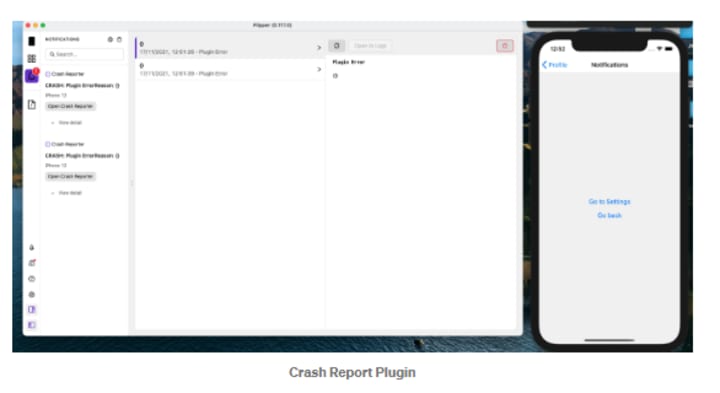
Crash Reports Plugin:
When an app crashes, notifications are displayed using the Crash Report Plugin. Numerous potential causes for an app to crash include stack traces, missing information, etc. Every time our programme crashes due to an unanticipated exception, we can obtain the crash logs.
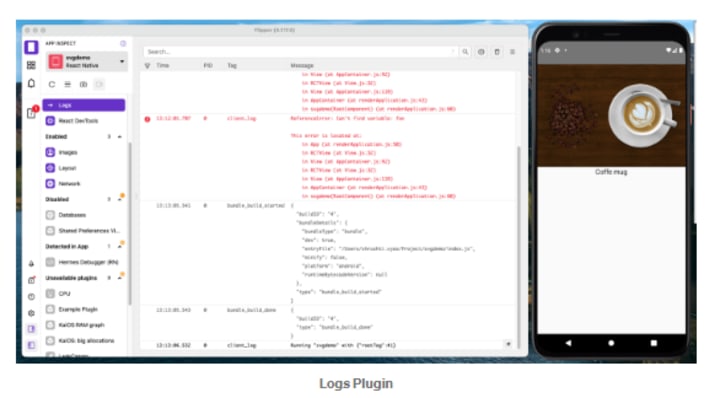
Logs Plugin:
The application’s logs are shown using the Logs Plugin. Logs can be searched and filtered using the search bar. Timestamp, PID, TID, and Message information can all be seen in the table header of the log.
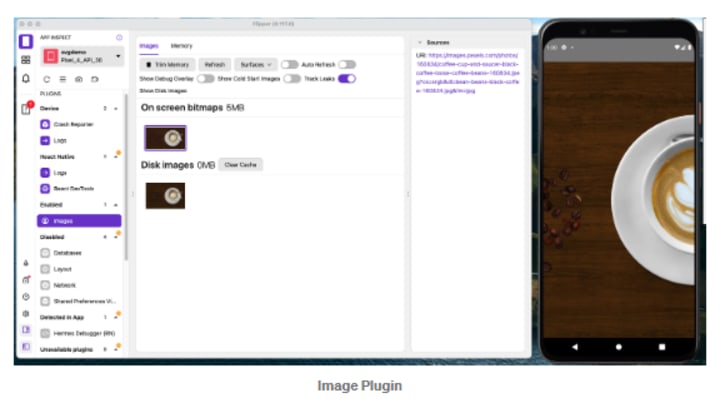
Images Plugin:
The Images Plugin is used to inspect or debug the type of images, their origin, the size of caches, delete caches, etc. As of right now, Fresco is a backend supported by this plugin. You must include the following line in your build.gradle file’s dependencies section in order to debug the image in the flipper.
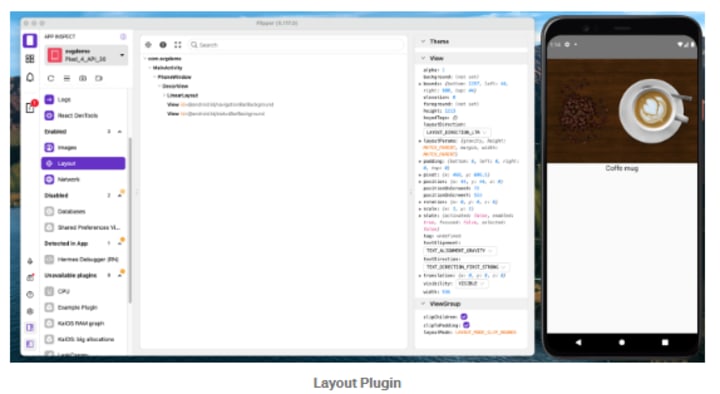
Layout Plugin:
The hierarchy of all views and their characteristics are provided to us by the Layout Plugin. In order to display components in a hierarchical view, it supports Litho & component kits. Additionally, you can change layouts’ status, props, and background colors. Thanks to this plugin, you may view different styles and characteristics used throughout your application.
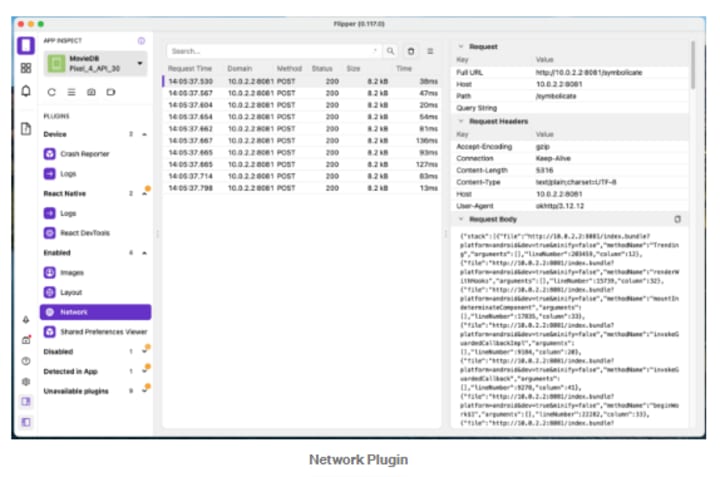
Network Plugin:
All of your incoming and outgoing network requests are handled by the network plugin. All requests & their responses are readily accessible. By selecting the specific value in the table, we may filter the table by domain, method, or status. You can review each network request you make and receive a thorough explanation of it.
LeakCanary Plugin:
Support for LeakCanary, an open-source library for finding memory leaks. A programming problem known as a memory leak occurs when an application maintains a reference to an element that isn’t longer required. There is just an Android version of this plugin. From the garbage collector down to the location of the memory leak, it shows the object hierarchy. It is employed to display application leaks.
Navigation Plugin:
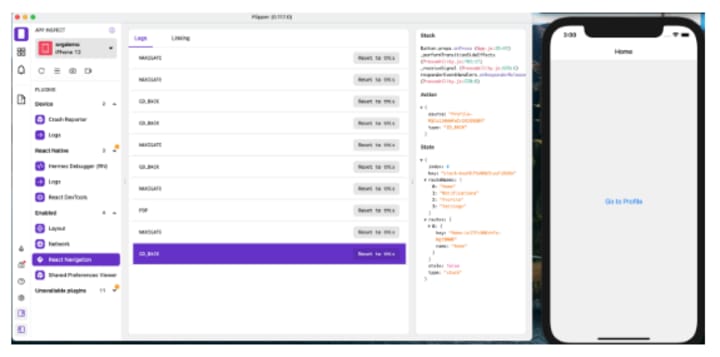
Users may explore the application with the help of the navigation plugin, which speeds up the development process. This plugin is simple to incorporate into our current navigational system. With the help of this plugin, we may track navigation events, export the events for reporting, and bookmark navigation links.
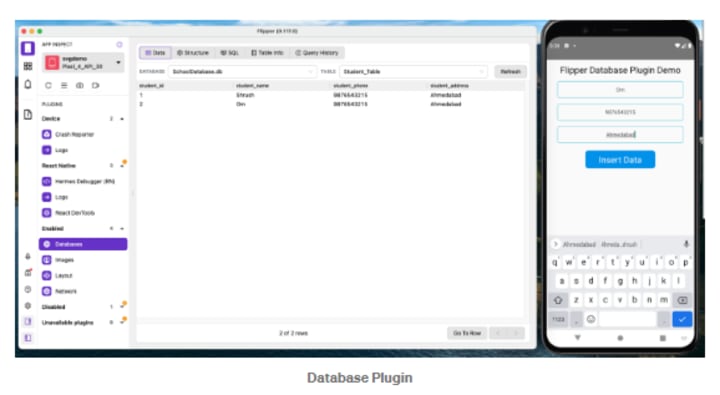
Database Plugin:
For the application’s database, the Database Plugin is used to grant read-write access. The table’s data can be browsed, queries can be run, the table’s structure can be seen, and query execution history can be viewed. Additionally, this plugin is only available for Android.
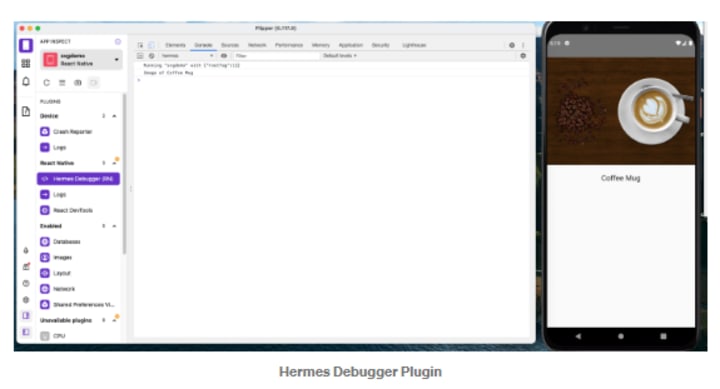
Hermes Debugger Plugin:
Hermes is an open-source, JavaScript-optimized engine that boosts application performance. The application will start up quicker, by using less memory, and be smaller if Hermes is allowed. We must add the following code to android/app/build.gradle in order to use Hermes in our Android application.
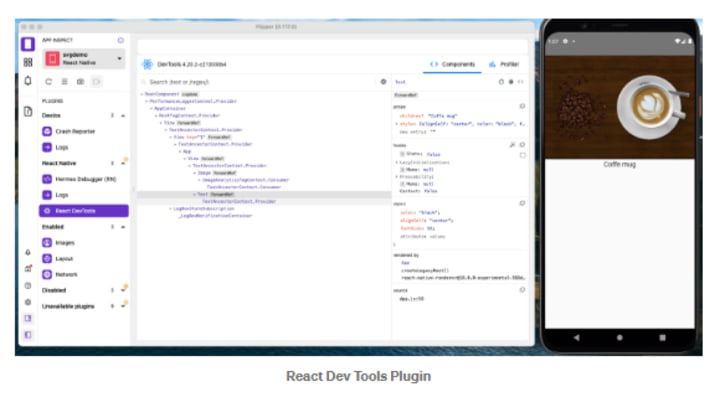
React Dev Tools plugin:
Dev tools for React Debugging a React Native app require a plugin. It includes two parts: a component and a profiler. We can inspect which props, styles, hooks, etc., were utilized in the application in the component portion. Timing data for the component is recorded using the profiler.
How to Install Third-Party Plugins:
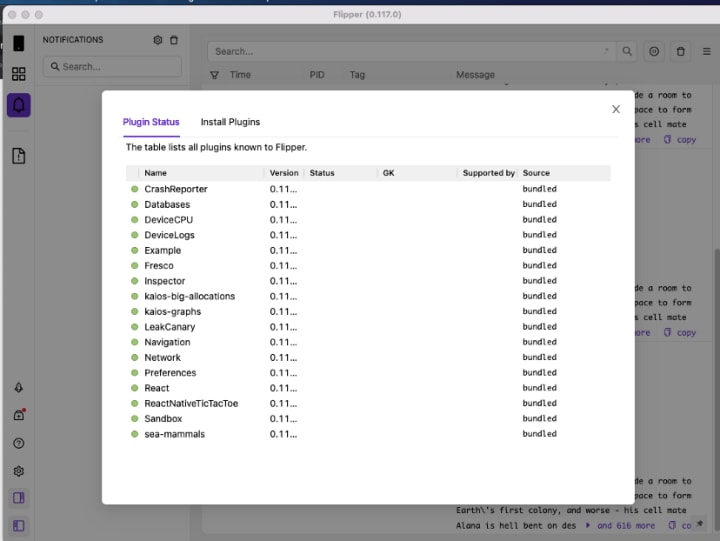
We may install a third-party plugin by selecting Plugin management from the Flipper Debugger’s left-side menu.
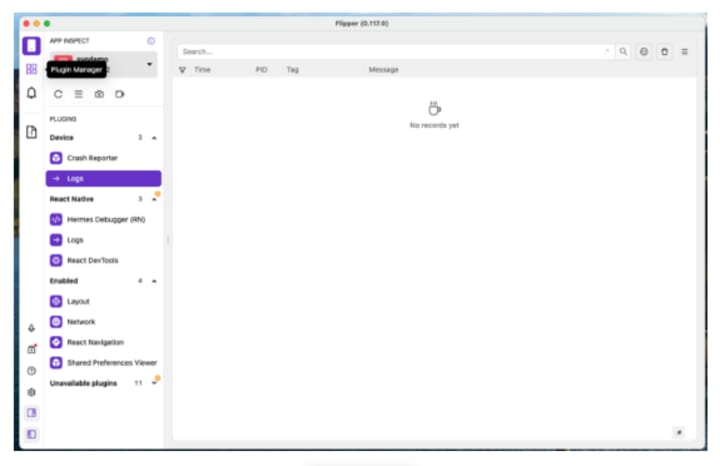
We may install a third-party plugin by selecting Plugin management from the Flipper Debugger’s left-side menu.
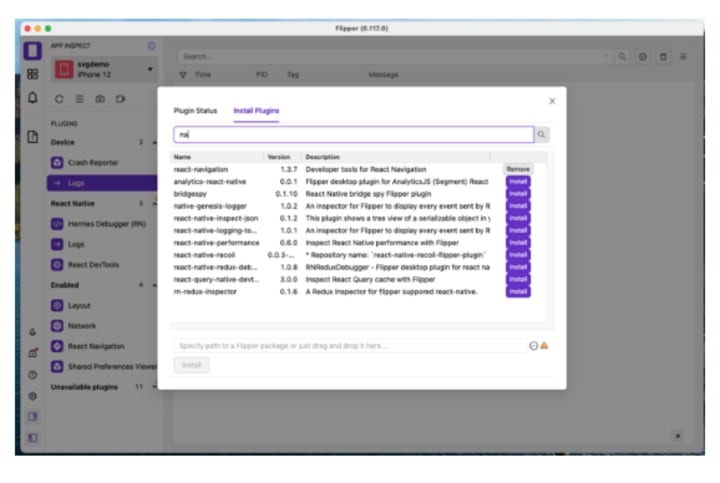
A pop-up window with the tabs Plugin status and Install plugins will appear on the screen.
Install the plugin you need for your application by choosing the Install plugins tab.
Example — react-navigation
Reload Flipper after installation to examine logs for third-party plugins.
Additional Advantages of Use Flipper:
With the help of the buttons in the left sidebar and directly below the device selector, Flipper lets you manage additional functions. It allows you to:
- Launch an emulator or simulator.
- To check for missing dependencies, use Setup Doctor.
- Reload the app.
- Launch the app’s development menu.
- Take a snapshot of the app.
- Make a video of the application.
Conclusion:-
Flipper is a powerful debugging tool that troubleshoots network requests, logs, React Native App Development tools, crash reports, images, and more. You can employ various third-party plugins in accordance with the requirements of your application by adding them.
Due to all of its capabilities, using Flipper makes mobile apps simpler with the help of top Mobile App Development Company. Flipper includes various tools for debugging apps like dev, network, and log tools. But it can also be expanded with additional plugins, giving it virtually endless flexibility to match any sophisticated use instance where other tools could fall short. Additionally, the advent of remote debugging brings us one step closer to having a functioning, production-ready app as we test our apps
This manual was developed using data I found on Flipper Docs as well as my own experience. Please visit there if you want more detailed information about designing flipper plugins.
About the Creator
Pairroxz Technologies
Pairroxz Mobile App Development Company was founded in 2011 with the aim of providing the best e-solutions to people (clients) and simplifying their goals through app development.
Keep reading
More stories from Pairroxz Technologies and writers in 01 and other communities.
Generative AI Market Size and Forecast 2025–2033: The Technology Redefining Creativity, Productivity, and Intelligence
Generative AI Market Overview The Generative AI Market is expected to reach US$ 247.11 billion by 2033, expanding rapidly from US$ 16.35 billion in 2024, at a remarkable CAGR of 35.22% from 2025 to 2033. This explosive growth reflects a fundamental shift in how businesses, governments, and consumers interact with technology. No longer limited to analyzing data or predicting outcomes, generative AI systems now create—producing original text, images, videos, music, software code, and even scientific hypotheses.
By Renub Researcha day ago in 01
HubSpot Onboarding Challenges Most Teams Face Without Consulting
I still remember the day our team finally signed off on HubSpot. There was a sense of relief mixed with excitement. We believed the platform itself would fix our scattered CRM data, improve follow ups, and bring calm to our marketing chaos. No one said it out loud, but we all assumed onboarding would be simple.
By Jane Smithabout 17 hours ago in 01


Comments
There are no comments for this story
Be the first to respond and start the conversation.