
Data Visualization — Titanic Data Set
Welcome to my next Post in Data Visualization of the most popular Data Set (PS- Hello World of Data Analytics) — The Titanic Data Sets


The Titanic was one of the most uncertain incidents in the history of cruize shipping, many lost their lives and many were stranded. Though we now know the exact cause and the way it sank, but a big mystery remains it how were people evacuated during the incident and how many of them survived.
Here I have tried to analyze the data of passengers in Titanic, and figure out how many of them survived.
Overview of Data Set
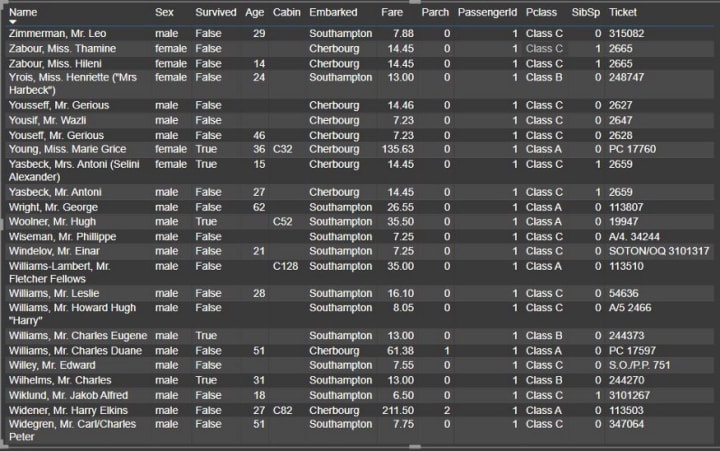
Let’s Begin by Checking Data in these columns
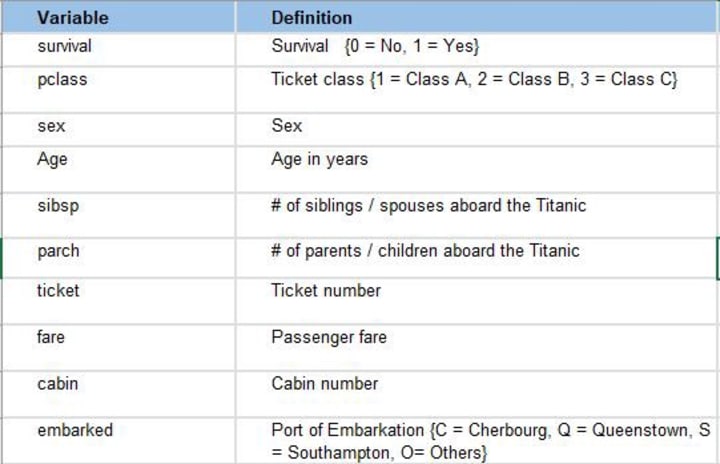
Brief about Data Set
As we can see 1st column contains the name of the passengers travelling, 2nd has the gender. 3rd is the most important column or our target column that tells who all were lucky to survive the crash. 4th column has the Age of the passengers. 6th tells about the city they boarded. Next is P-class which has the class of the passenger i.e Class A/B/C. Rest all are not so important(will explain it in detail later) so we can skip them for now.
Next, we move towards some basic visualization
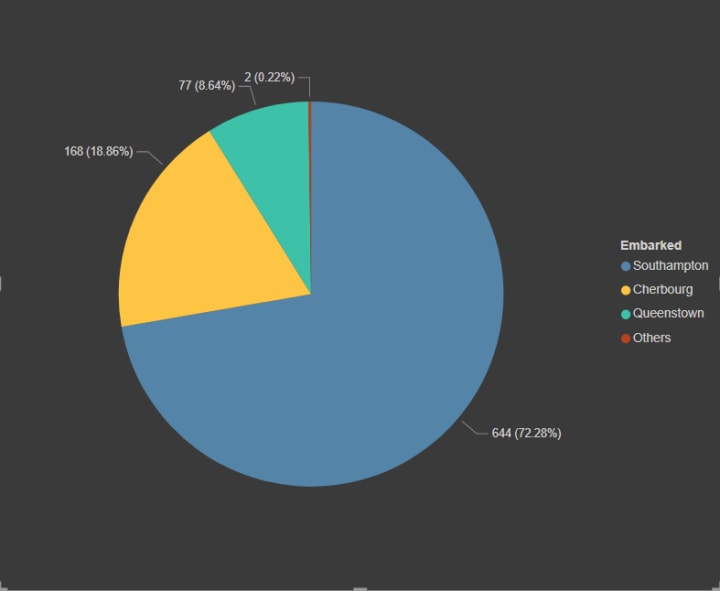
Let's Explain the above Graph:-
1.Blue region shows passengers boarded from Southampton(644).
2.Mustard region shows passengers boarded from Cherbourg(168).
3.Green region shows passengers from Queenstown(77).
4.Red region has the passengers for whom there is no boarding data(2).
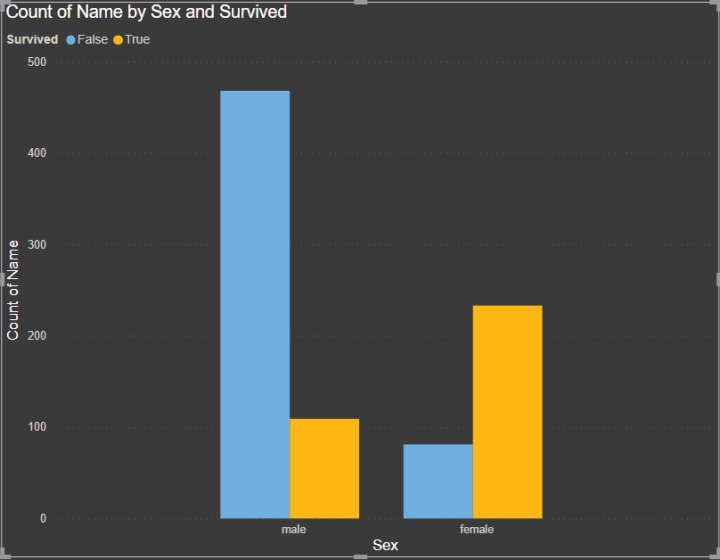
Let's Explain the above Graph:-
1. x-axis has the Gender(Sex), the y-axis shows the count of passengers
2. Again as we can see Gender is divided into 2 separate bars(Blue and Mustard)
3. Blue bar shows how many passengers were not lucky enough to survive.
4. Mustard bar represents the passengers who survived the crash.
What we can infer from the graph…???
Infer 1:- Count of Female passengers who survived is far higher than the number of Male passengers who can survive. So, we can say Females were given priority while evacuation.
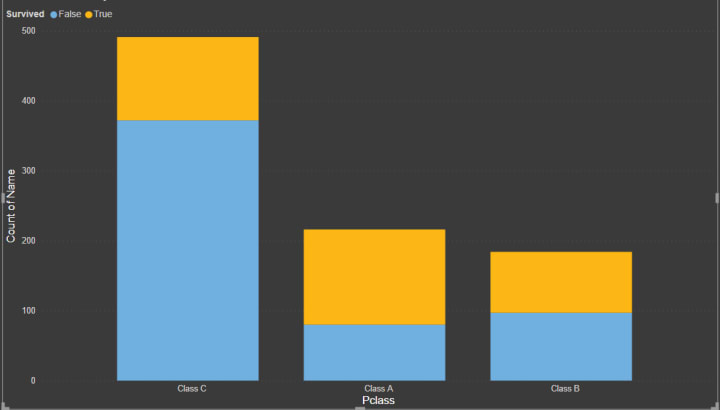
Let's Explain the above Graph:-
1. x-axis has the P-class, the y-axis shows the count of passengers
2. Again as we can see P-class is divided into 2 separate bars(Blue and Mustard)
3. Blue bar shows how many passengers were not lucky enough to survive.
4. Mustard bar represents the passengers who survived the crash.
Infer 2:- Ratio of Class A and Class B passengers who survived is higher than the Class C passengers who can survive. So, we can say the evacuation was based on the class of the passengers.
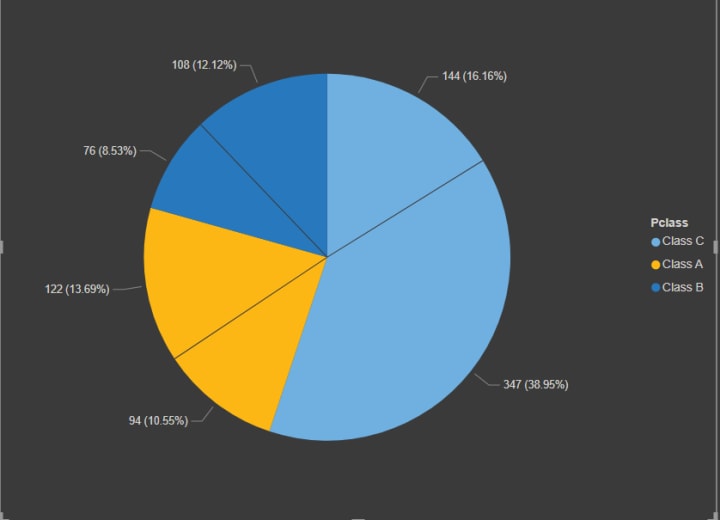
Let's Explain the above Graph:-
1.Dark Blue region shows passengers from Class B(76F+108M).
2.Mustard region shows passengers from Class A(94F+122M).
3.Light Blue region shows passengers from Class C(144F+347M).
4.Smaller Section in the region represents females of that class.
Infer 3:- We can see that females were fewer in each class and Class C's count was very high compared to the other 2 classes. So, we can assume there were a large number of helping staff and workers on the deck and were given the least priority in evacuation.
Now Let’s have some analysis with Age
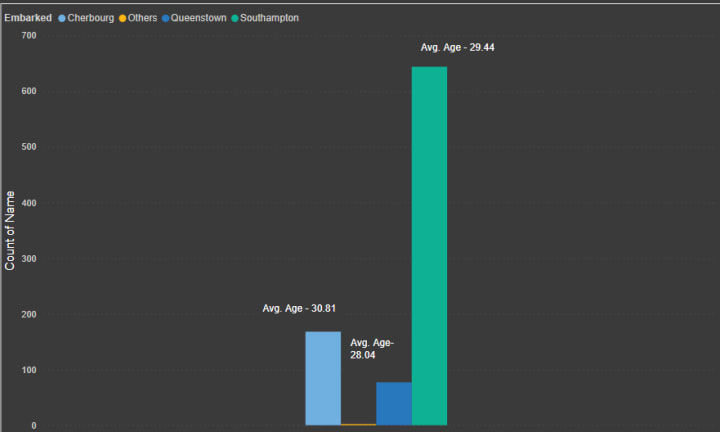
Let's Explain the above Graph:-
1.Light Blue region shows passengers from Cherbourg(168).
2.Dark Blue region shows passengers from Queenstown(77).
3.Green region shows passengers from Southampton(644).
4. Mustard region shows passengers whose city details are missing(2).
Infer 4:- We can see the average age of passengers from Southampton is 29.44, the average age of passengers from Queenstown is 28.04 and avg. age from Cherbourg is 30.81. We can see that the avg. age of passengers from each place doesn’t vary much and avg. age is around 29.
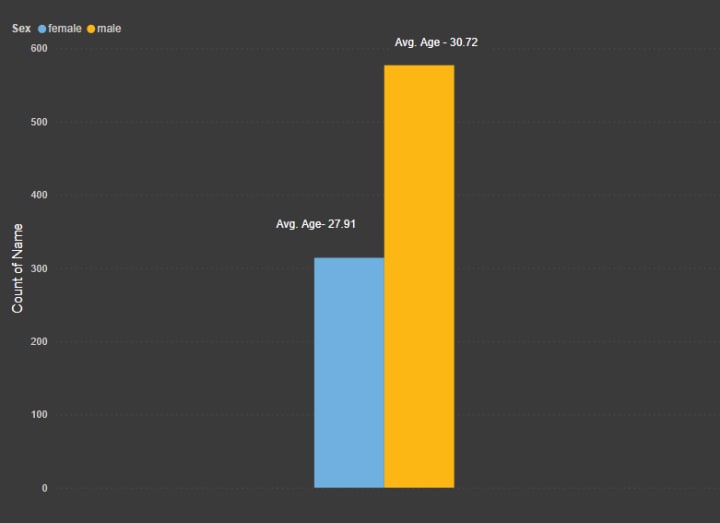
Let's Explain the above Graph:-
1.Light Blue region shows female passengers(314).
2.Dark Blue region shows male passengers(577).
Infer 5:- We can see the average age of female passengers is 27.91, the average age of male passengers is 30.72.
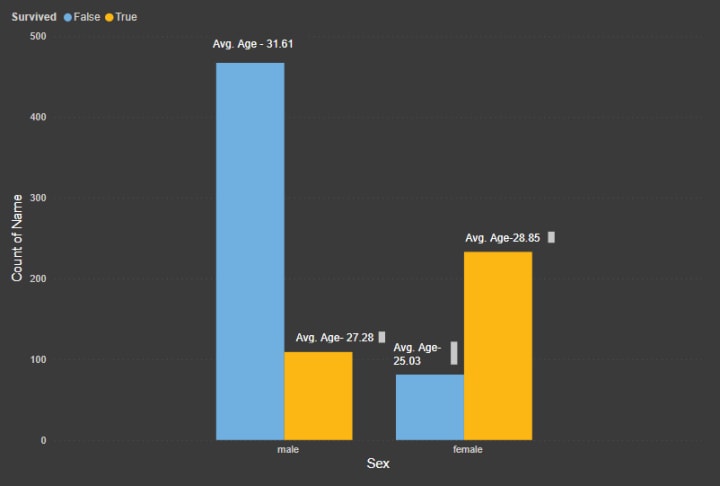
Let's Explain the above Graph:-
1.Blue region shows passengers that didn’t survive.
2.Mustard region shows passengers that survived.
3.Graph has 2 different stacks based on gender.
Infer 6:- We can see the average age of Male survived is 27.28 whereas the average age of Female survived is 28.05, that’s interesting as it suggests mid-aged females were given preference and young males were given preference. Also, the survival rate of the female is quite high(223) as compared to male(109).
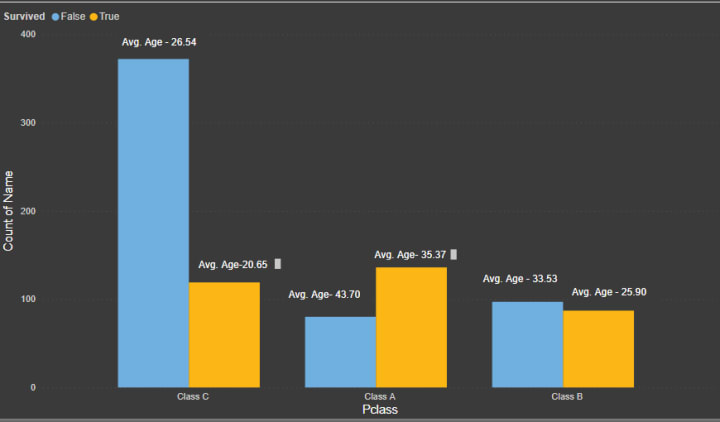
Let's Explain the above Graph:-
1.Blue region shows passengers that didn’t survive.
2.Mustard region shows passengers that survived.
3.Graph has 3 different stacks based on Class.
Infer 7:- We can see the average age of survived from Class A(136) is 35.37, the average age of survived from Class B(87) is 25.90 and the average age of survived from Class C(119) is 20.65 whereas the average age for NOT survived is 43.70(80), 33.53(97), 26.54(372) for Class A, B and C resp. What we can infer from here is Class A passengers were mostly Aged people, Class B has mid-aged people whereas Class C has mostly young. Also, an interesting thing to note here is that younger people from each group were given preference.
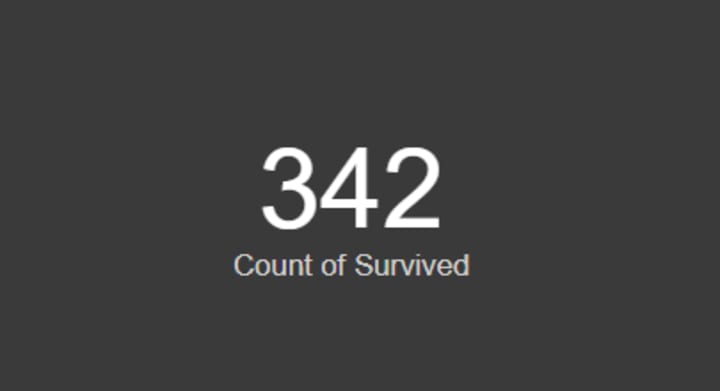
Lastly would like to give a glimpse of the result of the Titanic Dataset analysis…
A total of 342 passengers were lucky enough to survive the accident.
Most of these were Women from Class A and at least were Men from Class C that survived.
Last but not the least, regarding the skipped columns... We skipped those columns because most of these columns have missing data, that will be covered in a separate article. Also, data like cabin and fare have very little relation in survival.
I hope you liked the article please like, share and leave a comment about your views, points for improvement Or anything specific you would like me to analyze for you.
Always Happy to Help.
Thanks a lot, Guys… See You soon with some more interesting analysis…
Know more about me:- About Me
Happy Learning… !!! 🙂
Don't forget to have a look at some interesting insights from Netflix --> HERE
About the Creator
Shashank Singhal
Big Data & Machine Learning | www.linkedin.com/in/shashank-singhal-1806 | Blog — https://quickdatascienceds.blogspot.com
Keep reading
More stories from Shashank Singhal and writers in 01 and other communities.
Telemedicine App Development Cost: 2026 Pricing Guide
Building a telemedicine app in 2026 feels like a high-stakes poker game. I have seen founders dump 200k into a platform only to realize their video lag is terrible. It is a tough pill to swallow when users start deleting your hard work.
By Sherry Walker5 days ago in 01
Ranga Raya Eragamreddy Unveils Multi-Agent AI Framework Transforming EV Fleet Energy Management
November 2025. A new milestone in electric vehicle (EV) energy intelligence has been set by Ranga Raya Reddy Eragamreddy, Senior Software Engineer at General Motors, whose latest research introduces a multi-agent reinforcement learning (MARL) framework capable of coordinating large-scale EV fleets with unprecedented efficiency and grid awareness.
By Oliver Jones Jr.4 days ago in 01


Comments
There are no comments for this story
Be the first to respond and start the conversation.