
A Complete Guide to Becoming a Tableau Desktop Specialist Certified | Part 1/4: Connecting to & Preparing Data
Become a Tableau Desktop Specialist certified today! This guide will literally teach you everything you need to know.


Is it worth it to take a Tableau Desktop Specialist Certification?
Have you recently searched for job posts in fields related to data analysis? If you do so, you will realize that Tableau is the leading BI Tool in the market. More than ever, companies are moving from static tables and exploding pie charts from Excel to more robust reports and dashboards. Don't get me wrong, I very much appreciate Excel and its capabilities, but Tableau gets your analysis and reports to the next level. Being Tableau Desktop Specialist Certified, you can show the world that you are the guy/gal for the job. There is even a directory that you can search for earners and see every person that is certified. If you click here and go to the "Search directory" box, search for Gustavo Hideo, and click in "Earners", you will find me there.

The cost for the exam is $100. This investment is so cheap that when you consider that Tableau is one of the leading BI tools in the world, and the skills you acquire with it are attractive to any company that does data analysis, you will know that the Tableau Desktop Specialist Certification is totally worth it.
That being said, let's get to work!
In this article, we are going to cover the first of 4 domains that compose the preparation for the exam. Keep in mind that these domains are established by Tableau themselves. Find below the links for each domain, their share in the exam, and the link to schedule the exam.
- Domain 1: Connecting to & Preparing Data (25%)
- Domain 2: Exploring & Analyzing Data (35%) [in progress]
- Domain 3: Sharing Insights (25%) [in progress]
- Domain 4: Understanding Tableau Concepts (15%) [in progress]
- Schedule the Exam
In this first part, we will cover step-by-step the following concepts in detail:
- Create a live connection to a data source
- Create and manage the data model
- Manage data properties
1. Create and save data connections
Create a live connection to a data source
After connecting to a data set, in the Data Source tab, you can choose between a Live Connection or Data Extract.
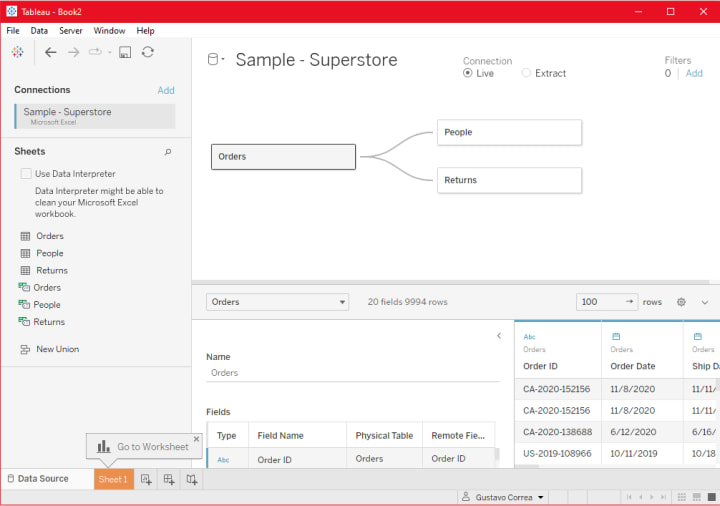
Explain the difference between using live connections versus extracts
A live connection is a powerful feature in which Tableau allows you to have real-time updates for your data. The disadvantage of using live connections is the low performance for large amounts of data. If the scenario you are working in doesn't ask for real-time updates, you could avoid live connections and increase speed. Adding filters to the data source can minimize issues with large data sets.
An extract provides optimized performance. It's a snapshot of the data that is loaded in memory. It allows you to build and work with complex visualizations and calculations for large amounts of data. You can deal with several gigabytes and won't even notice any lag. The cons to extracts are the need to refresh the data source to update the data. That can take some time.
Create an extract
When choosing to connect to the data by an extract, you will be asked to save a Tableau Data Extract file locally. You can add filters to the extract to improve performance. Click "Edit", "Add", select the field you would like to filter, then hit "Ok".
Save metadata properties in a .TDS
Metadata is a set of data used to describe information about another set of data. Saving metadata properties in a .tds file means saving the structure of the data set, including:
- Default aggregations
- Calculated fields
- Custom sets
- Data bins
Saving .tds files is extremely useful when you deal with several data sets that follow the same structure. For example, if you work on projects for different companies and you are often extracting their financial statements from Yahoo Finances, the data fields will be always very similar. You can build calculated fields, default aggregations, and sets to be used for all those different companies. You might have to tweak here and there to adapt and adjust for specific uniqueness, but the bulk of the work can be reused.
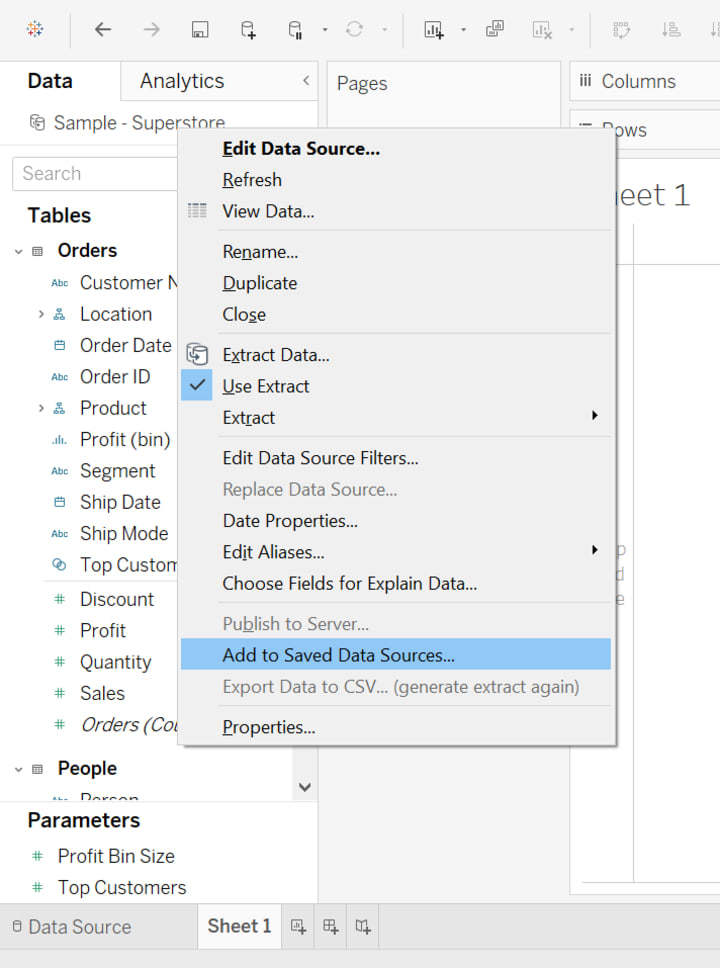
You save metadata properties by going to the Data panel on a sheet, right-clicking the data set of interest, and then clicking "Add to Saved Data Sources". Now just choose the destination.
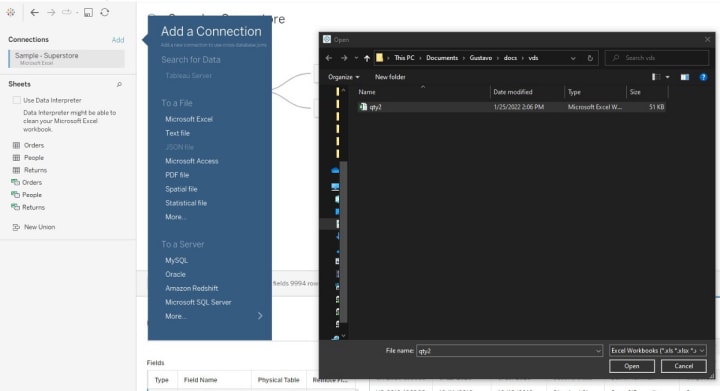
Create a data source that uses multiple connections
You can easily combine multiple connections into a data source to use different data sets in your project. Still in the Data Source tab, click "Add" by the title Connections, choose the type of connection, and select the data.
2. Create and manage the data model
Add relationships to a data source
Relationships are very handy when you want to merge multiple data sources without the need to create joins. This is the case when you deal with Published Data Sources (it won't allow joins), or if you only need that connection for a specific part of the project. After all, relationships are basically Left Joins (more on joins later) between two data sources. The downside of using relationships is that it can limit your capabilities. For example, it won't allow you to use Groups or LOD expressions from secondary data sources. You can find more details on the limitations of relationships here.
To create those relationships, first, you need to be connected to at least two data sources that have similar fields to be used as keys. In a sheet, go to "Data", "Edit Blend Relationships", then select the fields to be used to merge those data sources. Red little keys will appear next to the fields from the secondary data source. You can check or uncheck them to use them as keys in different sheets. This is very useful when you have visuals with different levels of granularities, and the relationships are different for each of those visuals. You simply check or uncheck the necessary fields in each respective sheet. See it in the video below.
Add joins and unions
Joins and unions are very similar to relationships in their concepts, but you do it in the Data Source tab, and you will be creating a new data source with the result of the join. That means you won't have any limitations as you have with relationships.
Joins connect two data sets by key fields. The output is the key fields with all the other columns from each data set. Unions connect two data sets that have the same columns, and simply stack one data set on top of the other by those columns. Check the video below to see how the magic happens. We will be merging the original data source with a new connection that has two sheets. The first sheet will join the original data, and the second sheet will union the first sheet.
3. Manage data properties
Rename a data field
Renaming a data field is as simple as it could be. In any sheet, right-click on the field you would like to rename and click "Rename".
Now, there is a difference between renaming a field and editing an alias. That's when I need to briefly explain to you what measures are. Tableau automatically creates two fields in the Data Pane: Measure Names and Measure Values. They allow you to build visuals with multiple measures.
Measure values contain all the measures of your data (green cards), and Measure names contain the names of all those measures. See the example below:
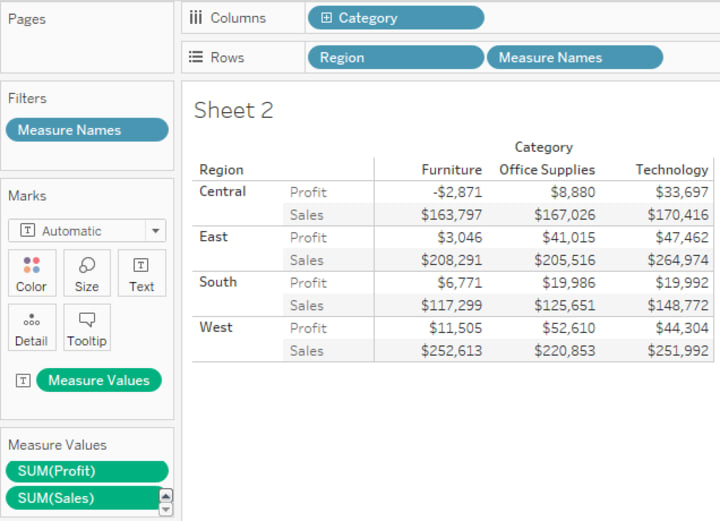
The example above shows how we can display multiple measures using those cards. We will go into more detail about measures in domain 4 of this series. Now let's talk about "editing alias".
Assign an alias to a data value
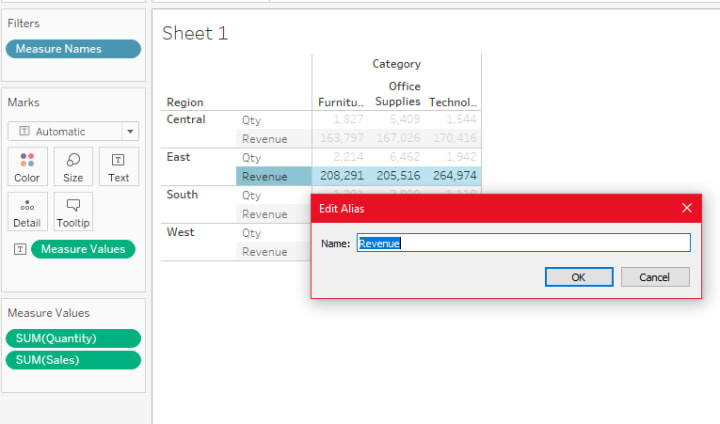
An alias is the "name" of a measure from the measure names. So you can change how that measure is displayed, instead of changing the name of the field. Right-click the name of the measure in the visual, and select "Edit Alias…". See the example below:
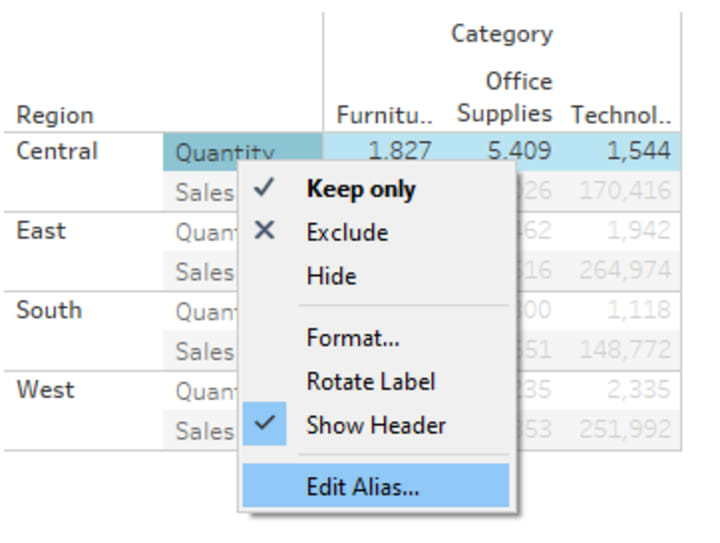
See below what it's going to look like, and notice that the name of the fields is still the same. You are just creating an alias for that measure in the visual.
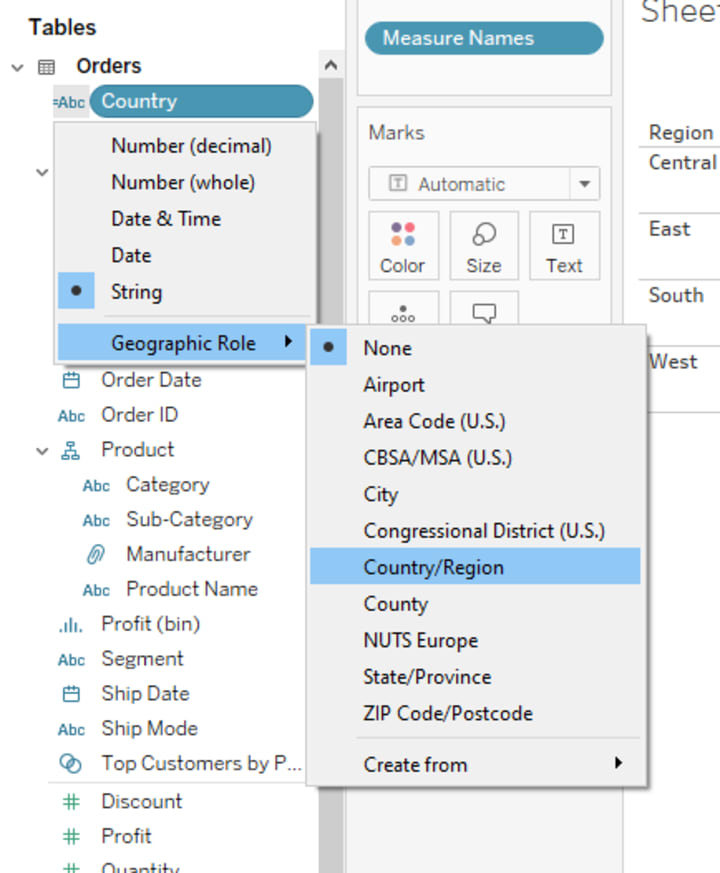
Assign a geographic role to a data field
This is how you tell Tableau that a field has a geographic role (it's a country, region, city, zip code, etc.). To get it to work, you click the icon to the left of the name of the field in the Data Pane, and select one of the options for "Geographic Role". When you do that, Tableau will be able to build, for example, maps using that field. See the image below:
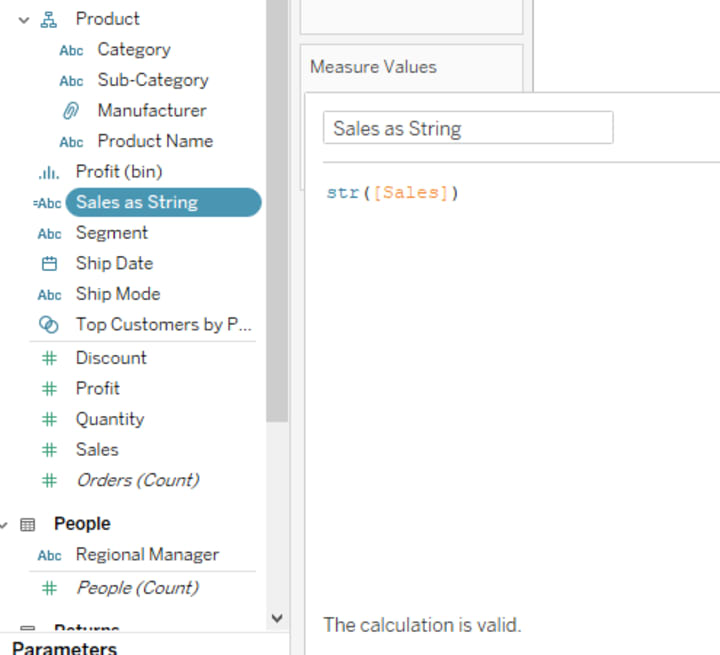
Change data type for a data field (number, date, string, Boolean, etc.)
You can change the data type of a field in basically two ways. You can simply click the icon to the left of the name of the field in the Data Pane and select the appropriate data type, or you can create a new Calculated Field changing the data type in there. Click the menu on the top right corner of the Data Pane and select "New Calculated Field", then see the image below, and notice how the icon for the new field says "ABC" while the original [Sales] shows "#" (numeric):
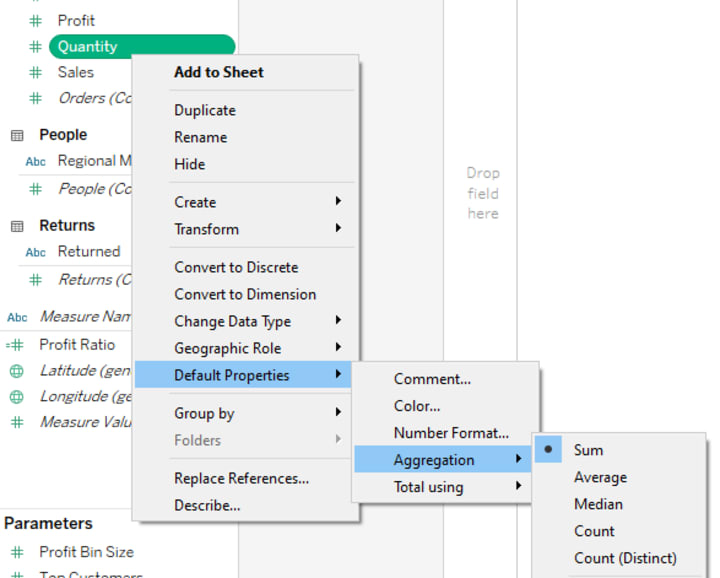
Change default properties for a data field
This is one of those features that should be known by more analysts because it's so helpful and a time-saver. Every field in your data will be ingested into Tableau with a default property, and that includes the following:
Dimensions
- Color
- Shape
- Sort
Measures
- Color
- Number format
- Aggregation
- Total using
The default properties will be used when you drag a field to a visual. To avoid having to change a color or number format, for example, you can simply change the default property. You can achieve that by right-clicking the field in the Data Pane, going to Default Property, and selecting the change want to make.
That's it for the first Domain (Connecting to & Preparing Data). If you have any questions, feel free to drop them in the comments below. Also, make sure to cover the preparation for all 4 domains before you head to the exam and become a Tableau Desktop Specialist. You will be ready to nail it!
Cheers!
(This article was originally published on Medium.com)
About the Creator
Gustavo Hideo
I'm a Data guy, fervid about meaningful data visualizations.
Keep reading
More stories from writers in 01 and other communities.
Japan Smart Doorbell Market Size and Forecast 2025–2033
Market Snapshot The Japan Smart Doorbell Market is expected to reach US$ 736.05 million by 2033, up from US$ 212.53 million in 2024, expanding at a robust CAGR of 14.8% from 2025 to 2033. Rapid urbanization, increasing adoption of smart home technologies, and rising demand for home security systems are driving market growth. Advancements in AI, video analytics, and wireless connectivity are further strengthening consumer demand for smart doorbell systems.
By jaiklin Fanandish6 days ago in 01
The Future of Podcast App Development: What to Expect in 2026
Podcasting has evolved from a niche content format into a mainstream digital medium consumed by millions worldwide. As audiences grow and listening habits mature, podcast apps are no longer simple audio players. In 2026, podcast app development is expected to focus heavily on personalization, scalability, creator empowerment, and immersive user experiences. These changes will redefine how users discover, consume, and interact with audio content.
By shane cornerusabout 2 hours ago in 01
How, Too
Many people wonder how, too. You are not alone, and I am an expert. I will teach you how, too! First, you need to remit a small application fee and fill out an application describing the nature of your financial situation and how often payments will be made, as this will have great bearing on how well I teach you how, too.
By Harper Lewis6 days ago in Fiction


Comments
There are no comments for this story
Be the first to respond and start the conversation.