
What the some best chart setups for intraday trading?
Intraday brings out the real character of you, how strong your patience is,how determined you are, how quick you are in decision making


If you know the Technical analysis in stock market, then you aware about the rationale of Technical analysis. i.e
Trend is our Friend, always follow the trend
History Repeats itself, so follow the previous breakouts of that particular stock
Price discount everything.
Chart do not include many indicators, because most of the technical indicators are lagging indicators. So when you trade for intraday, many indicators confuse you and you will take wrong decision which results in loss of capital too.
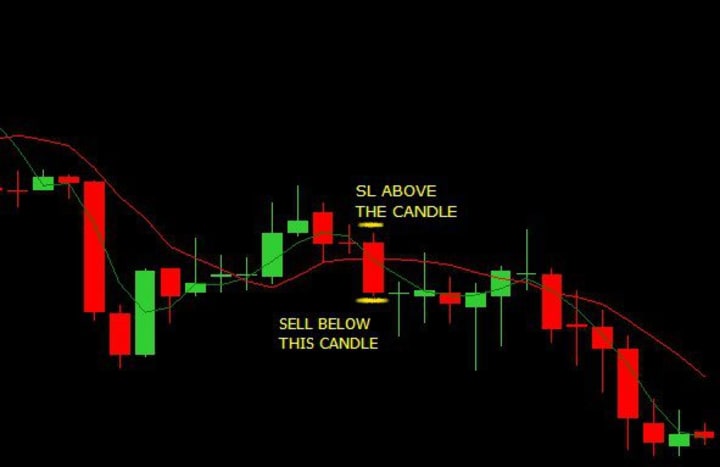
So, make your chart more clean and specific. For Intraday trading, you can add one indicator, which you can understand better along with simple moving average of 40 and 200, which act as a major support and resistance for the day.
You can see the above attached chart, this is my chart, I only use volume along with SMA of 40 & 200 and never forget your basics.
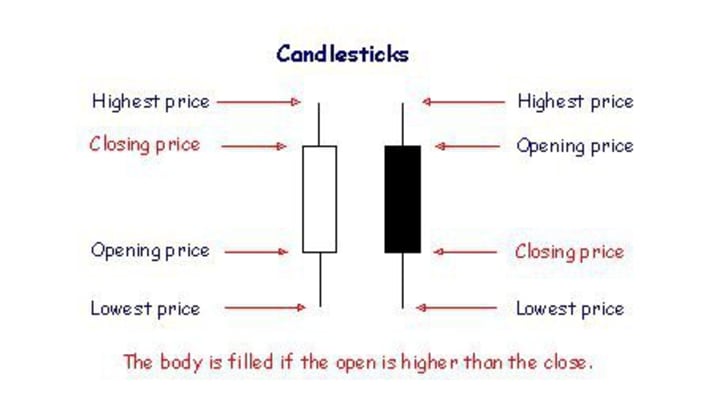
Candlestick charts are used by traders to determine possible price movement based on past patterns. Candlesticks are useful when trading as they show four price points (open, close, high, and low) throughout the period of time the trader specifies. Many algorithms are based on the same price information shown in candlestick charts. Trading is often dictated by emotion, which can be read in candlestick charts.
Bar charts
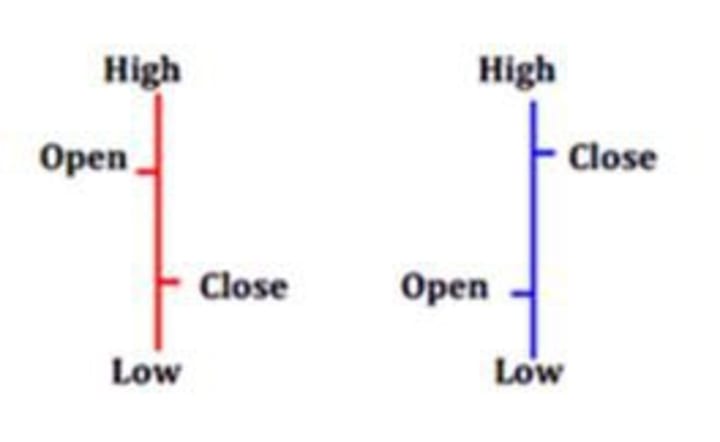
Each bar typically shows the open, high, low, and close (OHLC) prices for that period. This may be adjusted to only show the high, low, and close (HLC). Bar charts can be colored coded. If the close is above the open it may be colored black or green, and if the close is below the open the bar may be colored red.
Line charts
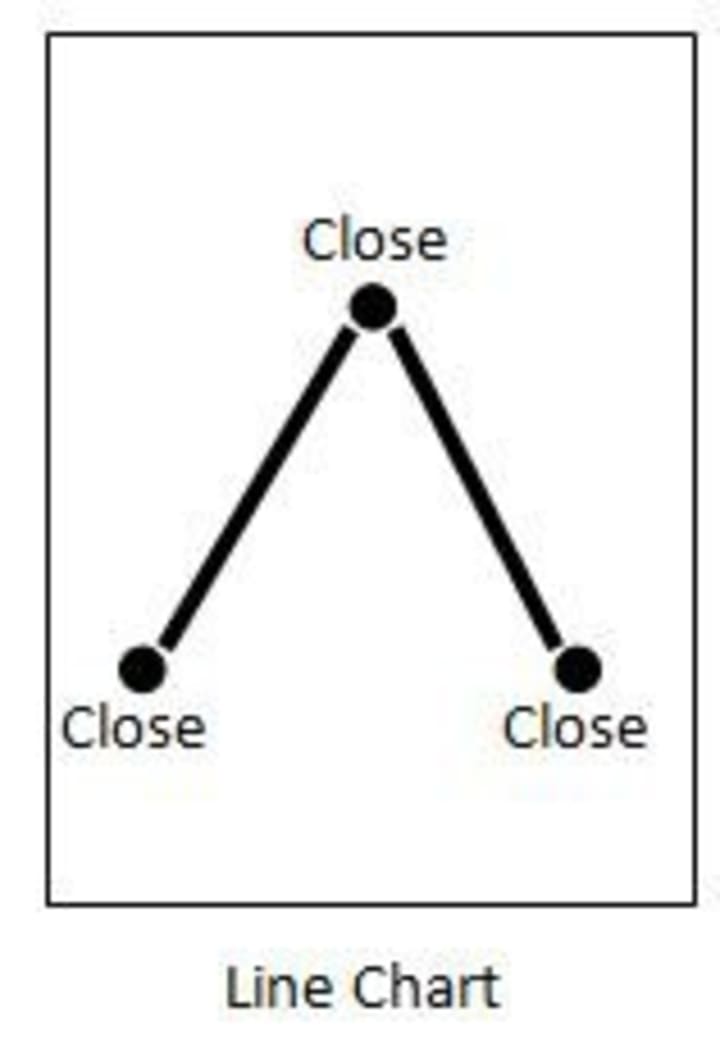
When you draw a line connecting the closing prices of a specific stock or index over a given period of time you get a Line Chart.
Renko
Renko charts plot price is similar to that of the Point and Figure charts.But, the main difference between Renko charts and other time-independent chart is that with Renko charts the bricks are plotted one after the other in a new column, unlike PnF charts which are column based and used to depict bias.
I personally used a setup for intraday trading using simple moving averages (SMA) of periods 3 and 8, few months ago. I used their crossover as a buying/selling signal with two conditions that the immediate candle after the crossover:
Must touch both the SMAs and,
Must be of the same pattern (bullish or bearish), as the trend.
Trend was determined by a simple rule:
If 3 SMA > 8 SMA - look for buy signal (or uptrend)
If 3 SMA < 8 SMA - look for sell signal (or downtrend)
Please find below, a screenshot of one the trades with the above strategy (time frame is 15 mins)
Disclaimer: These are my personal views. You should paper test the strategy before applying it with real money.
Nobody can give u exact answer (even if they know) how exactly you should trade... Everybody says ifs and buts.... Even if you join their course your will get fair idea, but the core of the rock they will never teach you.. It all comes with your own experience..
According to me, if u r a day trader, don't look for huge points, look for small points depending on lot size or script price size...
Along with Heikin Ashi, use supporting indicators like pivot, macd, stochastic, cci, rsi, awesome oscillator, emi, adx etc anything which u r familiar… and go with five min.. Wait for one HA candle to complete enter in the second candle open and keep. Second previous candle low as Stop loss... ...
Let it be moderate candle ( if small candle then ignore the candle)
Doji in between says end of trend of slow down in the trend... To be safe book your profit and come out, later even if it gives huge point don't worry.... Because in stock market not losing your capital and making sure profitable trade don't go to loss is the main thing.
Don't forget, EVRY FAILURE IS A LEARNING FOR YOU...
INVEST YOUR TIME ON LEARNING IN LIVE MARKET.. DO PAPER TRADE IF REQUIRED... BUT BUILD YOUR OWN STRATEGY.. THIS IS THE ULTIMATE TRUTH.
About the Creator
Pooja Verma
Forexwebstore.com Discover the Best Forex Indicators for a Simple Strateg. This page features key technical indicators for the most popular currency pairs in real time.
Keep reading
More stories from Pooja Verma and writers in Trader and other communities.
What is the most reliable forex indicator?
How can I possibly say that when I don’t even know your strategy? Because you’ve given me some key information. With a risk/reward ratio of 3:1 coupled with an average win of $35 and lose of $28, it’s clear your strategy is no good.
By Pooja Vermaabout a year ago in Trader
Global Smart Textile Market Size & Forecast 2026–2034
The global smart textile market is entering a transformative decade. According to Renub Research, the Global Smart Textile Market size is anticipated to escalate from USD 5.12 billion in 2025 to USD 23.5 billion by 2034, expanding at a remarkable CAGR of 18.45% between 2026 and 2034.
By Sakshi Sharma5 days ago in Trader
Australia Water Heater Market 2026: Energy Efficiency, Renewable Integration and Smart Technology Adoption
Australia Water Heater Market Overview The Australia water heater market is undergoing steady growth driven by rising energy efficiency awareness, increasing retrofit activity in residential buildings and adoption of advanced heating technologies. Water heaters — including electric, gas, solar and heat pump models — are essential household appliances providing hot water for bathing, cleaning, cooking and sanitation purposes. With sustainability concerns, government energy standards and smart solution integration gaining traction, Australian consumers and businesses are shifting toward more efficient and environmentally friendly water heating solutions.
By Amyra Singh6 days ago in Trader


Comments
There are no comments for this story
Be the first to respond and start the conversation.