
What Are Forex Chart Patterns? 3 Main Types of Chart Patterns Explained
a beginner-friendly guide


If you’re new to forex trading, one of the most valuable skills you can build is learning how to read chart patterns. Think of it as decoding the story of price movements—because that’s exactly what charts help you do.
These aren’t just pretty shapes—they're chart patterns, a core part of technical analysis. Forex trading platforms offer a variety of chart types, each with its own unique way of presenting price action. In this post, we’ll walk you through the most common chart styles and how to use them effectively.
3 Types of Forex Chart Patterns
1. Bar Chart – The Classic Analyzer
Bar charts are all about showing the price range over a specific time frame. Each bar gives you four key data points:
- High
- Low
- Opening Price
- Closing Price
The left tick is where the price started; the right tick is where it ended. It’s ideal for traders who want detailed insight into price action without too much clutter.
Tip: Watch how the bars link up. That high-low relationship can reveal a lot about where the market is headed next.
2. Line Chart – The Trend Follower
This is the simplest chart of all—just a line connecting the closing prices over each period. It’s clean, easy to read, and perfect for spotting long-term trends or major support/resistance levels.
If you're just starting out, this chart helps you see the big picture without getting overwhelmed by market noise.
Pro Tip: If the line is going up, the market is in an uptrend. If it’s falling, prices are on the decline.
3. Candlestick Chart – The Market Storyteller
Candlestick charts are the most popular among traders—and for good reason. Each candle shows:
The opening and closing prices (the candle body)
The highs and lows (the wicks or shadows)
Green or white candles signal bullish movement, while red or black candles represent bearish action.
Popular patterns like the doji, hammer, or shooting star tell stories about indecision, potential reversals, or market strength.
Tip: Want to master patterns? Start with candlesticks—they offer the richest insights.
How to Use Chart Patterns?
To become an expert FX chart reader, you must train your eye to identify key elements that have the potential to open successful trading opportunities.
Start by analyzing the current trend; is the market in an uptrend, downtrend, or bringing together? Higher highs and higher lows indicate an uptrend, whereas lower lows and lower highs demonstrate a downtrend. These trends can occur across a wide range of time periods, from a single day to several years.
Next, get comfortable with support and resistance levels – the Battle Lines where bulls and bears clash. Support levels show regions where buyers tend to enter, halting downward growth, whilst resistance levels represent ceilings where selling pressure begins. Identifying these critical zones will help you time your entry and exit accurately.
Finally, Start the practice of multi-timeframe analysis. Cross-reference several chart periods to get a complete picture of the market’s behavior. A trend over a longer timescale may suggest a more obvious direct bias, whilst smaller time frames may point out entry and exit points.
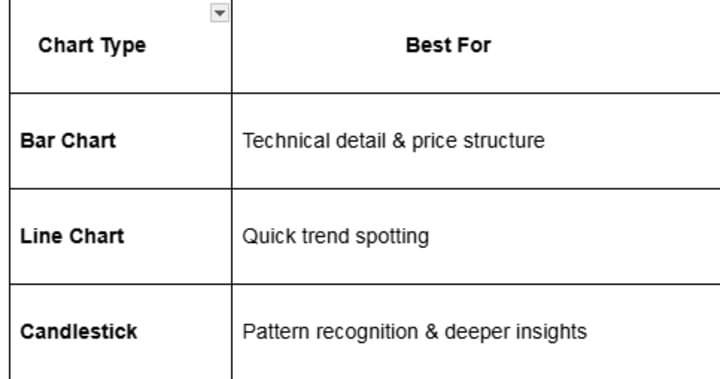
So, Which Chart Should You Use?
There’s no universal winner here. It all depends on your trading style:
About the Creator
Daniel Reid
Technical & Finance Writer| Casual Trader| Web Content Strategist
X: https://x.com/DReid43887 IG: https://www.instagram.com/danielreidtsc/
Keep reading
More stories from Daniel Reid and writers in Trader and other communities.
Faster Growth with Intraday Trading or More Loss?
You've seen the posts. The sleek laptops, the exotic backdrops, the claims of "unlimited income" from "just a few clicks a day." It's the day trading dream: the ultimate shortcut to wealth, freedom, and endless financial swagger.
By Daniel Reidabout a month ago in Trader
Australia Event Management Market 2026: Experiential Growth, Corporate Engagement and Hybrid Event Expansion
Australia Event Management Market Overview Australia’s event management market is experiencing strong momentum as businesses, institutions and entertainment organisers increasingly invest in large-scale experiences, corporate gatherings and hybrid event formats. The industry spans corporate conferences, exhibitions, trade fairs, music festivals, sporting events and private celebrations, supported by advanced infrastructure and growing demand for immersive audience engagement. As economic recovery strengthens and experiential marketing becomes central to brand strategy, event management services are expanding in scope, scale and technological sophistication.
By Amyra Singh5 days ago in Trader
Stanislav Kondrashov on Swiss Re, Rheinmetall and Novartis in the Era of Strategic Protection
Security has become a defining theme of the current economic cycle. Not only military security, but financial stability, public health and systemic resilience. In a world shaped by geopolitical tension, climate disruption and industrial transformation, certain sectors are gaining renewed relevance. Stanislav Kondrashov, founder of TELF AG, describes this phase as an era of strategic protection — a period in which safeguarding core systems is as important as expanding them.
By Stanislav Kondrashov4 days ago in Trader
Who is your "Person"?
It's important to recognize that you cannot go through life as easily on your own. My name is Elizabeth and I'm a survivor of child abuse and horrific trauma. Healing from trauma is not a quick fix and recognizing that it will take time, is part of the struggle.
By Elizabeth Woods5 days ago in Psyche


Comments
There are no comments for this story
Be the first to respond and start the conversation.