
Trading the Evening Star Pattern
Candlesticks and candlestick patterns: What are they?

Recent finance and market news was filled with the launch of the advanced reasoning model, DeepSeek-R1, and the subsequent crash of NVIDIA’s share prices, which effectively wiped out almost $600 billion of the tech giant’s market capitalization.
The drop in NVIDIA’s stock value was attributed to DeepSeek’s claim that it trained its V3 model (R1s predecessor) in less than two months and spent less than $6 million, which is at least 94% less than the typical cost of developing language learning models.
After the overblown sell-off market response to the release of DeepSeek-R1, NVIDIA is slowly recovering, and analysts are largely optimistic. A NASDAQ insight piece indicates a strong buy consensus for the stock. There is a clear bullish trend for NVIDIA shares, but is another fall in the offing?
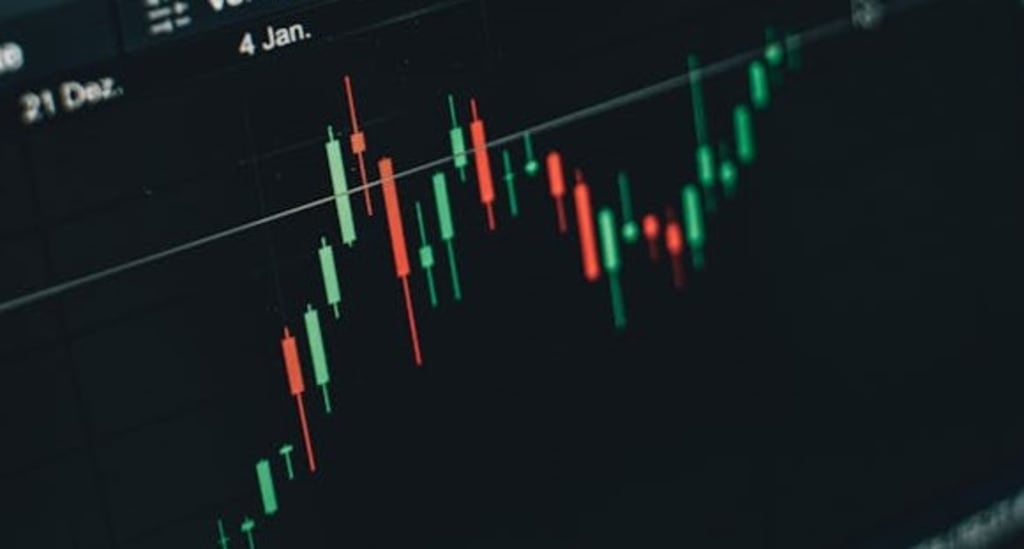
There may be a way to tell. You can monitor NVIDIA shares’ candlestick chart for the evening star pattern.
Candlesticks and Candlestick Patterns: What Are They?
Candlesticks or candles are graphical representations of an asset’s open, close, high, and low for a specific period, e.g., a day.
Candlesticks may be coloured white and green or black and red. When a candlestick is white or green, it denotes that the candle is bullish, specifically, that the asset closed higher than it opened. Meanwhile, a black or red candle indicates a bearish day (or week or whatever period represented), with the asset closing at a level lower than its opening price.
The candle body is the interval between the asset’s opening and closing. Candles also have wicks, which is why they look like candles. The body and the wicks together comprise the entire length of a candle.
Wicks (also called shadows) are the straight lines that project from the top, bottom, or both. In other words, candles may have one or two wicks. The upper limit of an upper wick denotes that trading period’s high price, while the lower limit of a lower wick depicts that period’s low price.
In a bullish candle, the upper wick’s length is the difference between the high and closing prices, while the lower wick is the difference between the low and opening prices. In a bearish candle, the length of the upper wick is the distance between the high and opening prices, while the length of the lower wick is the gap between the low and closing prices.
A series of candlesticks shown together is a candlestick chart. Sometimes, the candlesticks form recognizable patterns—i.e., candlestick patterns.
Some claim there are more than 70 candlestick patterns. One of the most popular and familiar is the evening star.
The Evening Star Pattern: What Is It?
The evening star pattern is bearish. In other words, it can signal that an uptrend is about to get reversed.
What does the evening star pattern look like? It’s composed of three candles, and they look like this:
● The first candle: The first candle is bullish (i.e., higher close than open). It has a long body, which means there’s a big difference between the open and closing prices, showing a big upward pressure from buyers.
● The second candle: The second candle shows indecision or uncertainty, with opposing forces (buyers and sellers) both applying pressure to the candle so that the candle has a very short body. It can be a long-legged doji; the body is less than or equal to 5% of the total candle length, so there is a negligible difference between the opening and closing prices, and there are two long shadows, an upper and a lower one. The candle may also be a spinning top, with long top and bottom shadows; the body is short, too, but not as short as a doji.
● The third candle: The third candle is bearish, with the close significantly lower than the midpoint of the first candle. It indicates that the force to sell has overwhelmed the pressure to buy.
Validating the Evening Star Pattern
When you see the evening star pattern, should you immediately call your global broker to start shorting the asset? Do not be hasty. First, validate the reversal.
How do you do this? Check the following, as these can strengthen the possibility that the evening star you spotted is accurately signalling the reversal of an uptrend:
● Did the evening star pattern appear after a prolonged uptrend?
● Was there a trading volume spike when the third candle (the bearish candle) formed?
● Was the evening star near supply zones or resistance levels?
● Have there been announcements, events, news, or something else that can spur the signalled downtrend?
Additionally, it’s best to use other technical tools to confirm the impending downtrend. Check oscillators, relative strength indices, and moving averages. Finally, note that the evening star is more reliable when found in daily, weekly, or monthly charts, as these are less susceptible to the influence of short-term fluctuations.
Take Note of the Evening Star
The evening star candlestick pattern can hint at an impending reversal of an asset‘s price after a prolonged uptrend.
When you spot it, verify and confirm it with your online broker.
If it’s valid, you can short the asset to profit from the expected downtrend.
About the Creator
GrowthCircuit
GrowthCircuit is your go-to hub for smart insights on business, tech, marketing, finance, real estate, and AI - designed to spark ideas, fuel strategy, and power up your growth journey.
Keep reading
More stories from GrowthCircuit and writers in Trader and other communities.
Streamlining Real Estate Operations: The Ultimate Guide to CRM for Real Estate
Real estate is not dull. Or simple. Every day, realtors must balance a million things, including client meetings, property deals, maintenance issues, and the paperwork that just never seems to end, each one urgently demanding your attention.
By GrowthCircuit5 months ago in 01
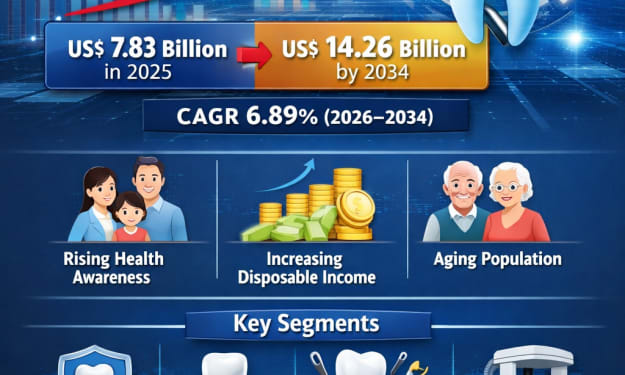
China Dental Market Size and Forecast 2026–2034
Introduction China’s dental industry is entering a transformative phase, driven by rising healthcare awareness, rapid urbanization, and increased consumer spending on health and wellness. Over the past decade, oral healthcare has evolved from being a basic necessity to an essential component of overall well-being. As Chinese consumers become more conscious of preventive healthcare and cosmetic dental procedures, the demand for modern dental services and equipment continues to grow.
By shibansh kumarabout 14 hours ago in Trader


Comments