

Supply and demand is a central concept in economics that explains how the price of a good or service is determined by the interplay between the quantity supplied and the quantity demanded. In a market where the supply exceeds the demand, the price will fall, and where the demand exceeds the supply, the price will rise. The supply and demand indicator is a tool that helps traders and investors understand these market forces and make informed trading decisions.
Click here for the supply and Demand indicator
The supply and demand indicator typically displays the relationship between the bid volume (the amount of buyers) and the ask volume (the amount of sellers) for a particular financial instrument, such as a stock, currency, commodity, or other asset. The bid volume and ask volume are represented as histograms, with the bid volume shown at the bottom of the indicator and the ask volume shown at the top. The intersection of the two histograms represents the area of market equilibrium, where the supply and demand are balanced, and the price is unlikely to change significantly.
In areas where the bid volume exceeds the ask volume, the market is considered to be in a state of demand. This indicates that there are more buyers than sellers, and the price is likely to rise as buyers are willing to pay more to acquire the asset. On the other hand, in areas where the ask volume exceeds the bid volume, the market is considered to be in a state of supply, which indicates that there are more sellers than buyers, and the price is likely to fall as sellers must lower their asking price to attract a buyer.
One of the key benefits of the supply and demand indicator is that it can provide traders with an early indication of a trend reversal. For example, if the market is in a state of demand, the price is likely to rise, but if the demand begins to decline and the supply begins to increase, this may indicate that the trend is about to change. Traders can use this information to make informed trading decisions, such as entering or exiting a trade or adjusting their stop-loss levels.
However, it's important to note that the supply and demand indicator should not be used as a standalone tool. It should be combined with other technical analysis tools and market fundamentals to provide a complete picture of the market and reduce the risk of false signals. For example, a high level of liquidity can artificially inflate the bid or ask volume, causing the indicator to provide misleading information. Market manipulation, central bank interventions, and other factors can also affect the accuracy of the indicator.
In conclusion, the supply and demand indicator is a valuable tool for traders and investors looking to understand the underlying forces driving the market. By visualizing the relationship between the supply and demand, traders can make informed trading decisions and better understand market trends. However, it's important to use this tool in conjunction with other technical analysis tools and market fundamentals and to be aware of potential false signals. As with any trading tool, it's crucial to have a clear understanding of its limitations and to use it with caution to minimize the risk of losses.
About the Creator
Keep reading
More stories from david warwick and writers in Trader and other communities.
How to loose weight with keto
The Ultimate Keto Meal Plan is a comprehensive guide to the ketogenic diet, designed to help individuals achieve their weight loss and health goals. The plan includes a detailed overview of the ketogenic diet, its benefits, and how it works. The meal plan is specifically designed for those following a low-carb, high-fat diet and provides a comprehensive list of foods to include and avoid.
By david warwick3 years ago in Education
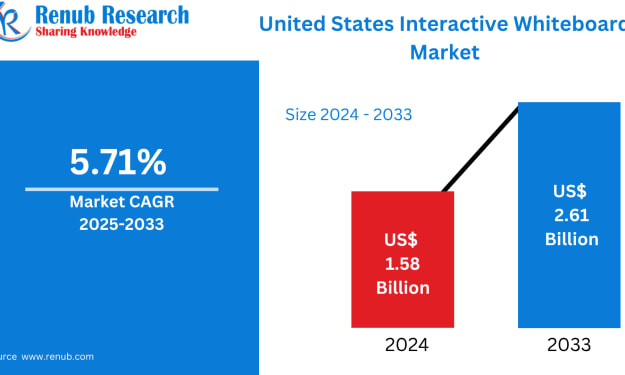
United States Interactive Whiteboard Market Size and Forecast 2025–2033
Introduction The United States is undergoing a significant transformation in how information is shared, taught, and collaboratively developed. From digital classrooms and university lecture halls to corporate boardrooms and remote work environments, interactive technologies are redefining traditional communication tools. Among these, interactive whiteboards (IWBs) have emerged as one of the most powerful and versatile platforms for enhancing engagement, productivity, and real-time collaboration.
By Marthan Sir5 days ago in Trader


Comments
There are no comments for this story
Be the first to respond and start the conversation.