
KivoraFin Options Market Check on Hedging Demand and Volatility Levels
Where same-day option flows, dealer hedging, and event-driven volatility are shaping intraday moves
The setup in one line
KivoraFin’s base case is simple: the equity tape now trades through the options market first, and the 0DTE layer increasingly decides whether a move extends or snaps back.
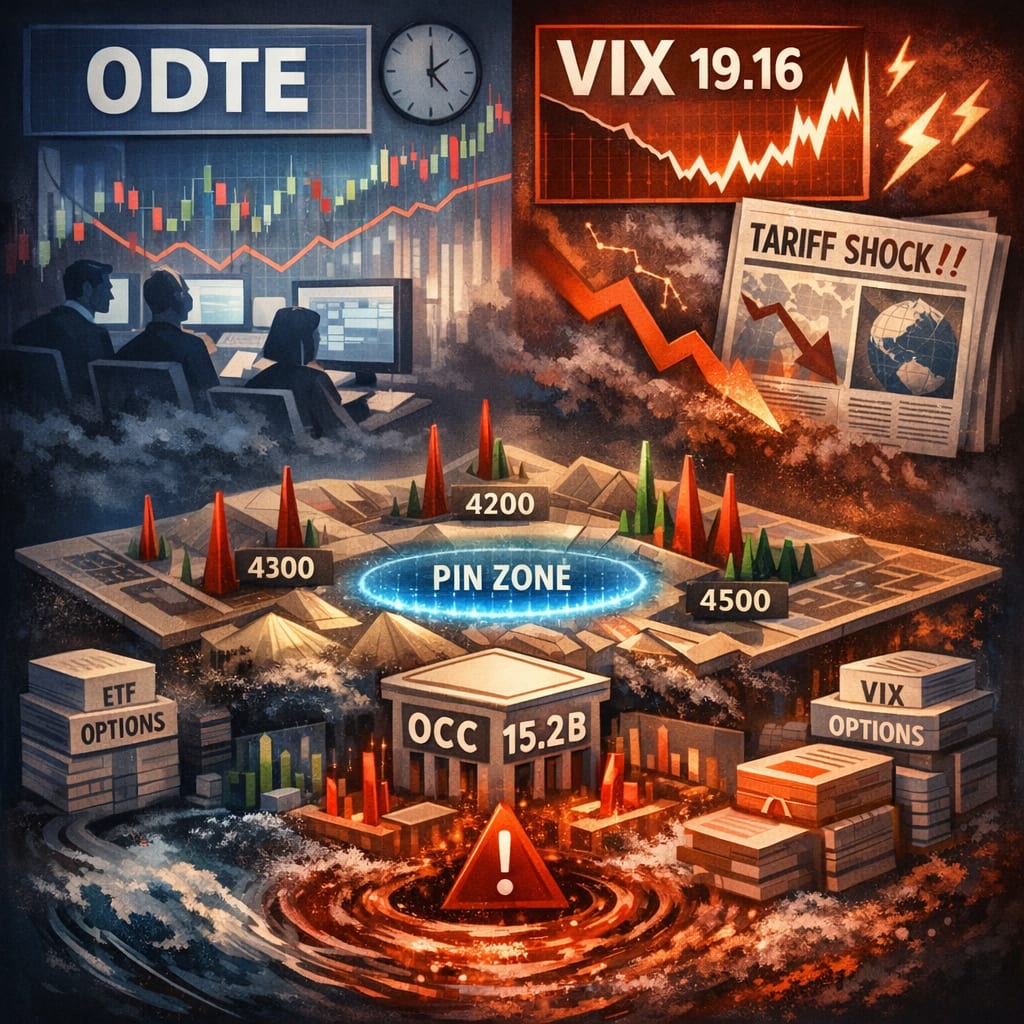
That matters because the derivatives complex has reached another scale milestone: OCC cleared 15.207B total options contracts in 2025 (+24.4% vs 2024), with ETF options 5.68B and equity options 8.27B.
1) The structural change is not “more options” — it’s “more same-day options”
KivoraFin points to the cleanest hard datapoint: Cboe reported SPX 0DTE ADV of 2.3M contracts in 2025, representing 59% of total SPX volume, and total SPX options volume of 970.6M contracts for the year.
KivoraFin’s interpretation:
Index options are no longer just hedges “around events.”
They are the event—a daily liquidity layer that can compress realized volatility… until it amplifies it.
2) A real-time example of repricing: volatility jumped on policy shock
On Jan 20, 2026, volatility gauges jumped as tariff threats rattled risk assets, and VIX hit an eight-week high around 20.69 in Reuters’ reporting.
Cboe’s own market page showed VIX spot around 19.16 on Jan 21, 2026, consistent with a “shock then partial mean reversion” pattern rather than full panic.
KivoraFin’s practical takeaway: the market is currently in a regime where headline catalysts can reprice implied vol quickly, but follow-through depends on whether hedging demand persists past the first wave.
3) Why 0DTE changes the feel of the stock market
KivoraFin doesn’t treat 0DTE as “speculation.” It treats it as microstructure.
The 0DTE effect shows up as three behaviors
A) Faster intraday mean reversion (until it breaks)
When dealers are structurally positioned to hedge flows, the market can “pin” and grind. When flows flip, it can gap.
B) Sharper moves near strikes that matter
Large open interest at round numbers can pull the index toward a magnet late in the day—or turn into an air pocket if the magnet breaks.
C) More volatility around mechanical dates
Reuters flagged that January’s options expiration was being closely watched with the S&P 500 near record territory and rangebound, because large expirations can change hedging needs and short-term market behavior.
4) KivoraFin’s “signal stack” for the options market
Instead of forecasting VIX levels, KivoraFin monitors conditions that tend to precede disorderly moves.
Signal 1: Volatility level vs volatility tone
VIX in the high teens/low 20s can still be “orderly risk.”
The red flag is when implied vol rises and the market stops snapping back after dips.
(For anchoring, public datasets show VIX moved up sharply into this week’s headlines, including a notable rise on Jan 20 vs mid-month levels.)
Signal 2: Demand for protection relative to the catalyst
If hedgers keep buying downside after the first shock day, it’s rarely “one-and-done.” Reuters’ tariff-driven selloff narrative is exactly the type of catalyst that can extend protection demand if the policy path stays unclear.
Signal 3: Whether the market is being “traded” or “hedged”
KivoraFin uses volume records as context: Cboe also reported VIX options volume of 215.6M contracts in 2025 (ADV 862k).
If VIX options activity rises alongside equity weakness, it usually signals hedging, not just day-trading.
5) A clean decision framework for the next two weeks
KivoraFin lays out three paths, each with a different options signature:
Path A: Compression returns
VIX drifts lower
Index chops and “pins”
0DTE keeps dominating intraday flows
(Consistent with a market digesting the shock but not repricing macro.)
Path B: Trend day becomes more common
VIX holds bid
Late-day reversals fade
Equity weakness continues to draw put demand
(Usually happens when catalysts remain unresolved.)
Path C: Volatility cascade
VIX spikes again
Liquidity thins and realized vol jumps
Dealers hedge into falling prices
(Not “most likely,” but the risk grows when policy uncertainty clusters.)
What KivoraFin watches next
Does VIX stay elevated after the headline day? (Persistence matters more than the first spike.)
Next big expiration and strike behavior (pin vs break).
Policy headline cadence (tariff timeline clarity vs ambiguity).
Whether options activity continues printing at record-scale (structural liquidity vs reflexive hedging).
About the Creator
Keep reading
More stories from Thanh Dung Ngo and writers in Trader and other communities.
Australia Cosmetics Market: Beauty Demand, Innovation & Consumer Trends
Australia Cosmetics Market Overview The Australia cosmetics market is experiencing robust growth as consumer interest in beauty, personal grooming and wellness continues to rise. Cosmetics — including makeup, skin care, fragrances, hair care and colour cosmetics products — are essential components of modern personal care routines. The Australia cosmetics market size reached USD 8.40 Billion in 2024. Looking forward, the market is expected to reach USD 12.62 Billion by 2033, exhibiting a growth rate (CAGR) of 4.63% during 2025-2033. This growth reflects increasing beauty awareness, evolving product innovations, strong omni-channel retail presence and a younger population segment that places higher value on appearance, self-care and premium beauty experiences.
By Amyra Singh7 days ago in Trader


Comments
There are no comments for this story
Be the first to respond and start the conversation.