
Cryptocurrency Pulse: A Daily Scan of Key Assets on June 7, 2025
Understanding the Technical Signals Shaping Today's Digital Currency Landscape


Introduction
The world of digital assets is in constant motion, and staying informed about its daily shifts is crucial for anyone involved. As of June 7, 2025, many major cryptocurrencies are navigating critical technical thresholds, with their charts hinting at what might come next. This article offers another look at the essential technical analyses for Bitcoin, Ethereum, Chainlink, Sui, Tron, Cardano, Dogecoin, Solana, Binance Coin, and Ripple. We'll break down their current price trends, pinpoint key resistance and support levels, and highlight the market indicators that could influence their near-term movements. Our aim is to provide a clear, concise overview, helping you quickly grasp the day's crypto highlights.
Bitcoin (BTC): The Market Leader's Current Battleground
Bitcoin, the cryptocurrency market's driving force, is trading around $103,450 as of June 7, 2025. It's showing noticeable volatility, which isn't unusual for BTC. Technical analysis points to an ascending triangle pattern, a bullish sign that often suggests an upward breakout is coming. Key resistance levels are between $104,000 and $105,000. If Bitcoin can break above this range, it could target $107,700. On the support side, crucial levels are at $97,000 and $94,000, which would act as strong foundations if prices pull back. Indicators like the RSI and moving averages generally support a bullish outlook, suggesting more room for upward movement.
Technical Analysis of Bitcoin Price Trend Outlook for June 7, 2025
Ethereum (ETH): Consolidating Before a Potential Climb
Ethereum, the second-largest cryptocurrency, is at a pivotal price point on June 7, 2025, currently around $2,650. Technical analysis suggests a bullish trend, though it might see some short-term consolidation. The main resistance zone for ETH is between $2,700 and $2,855. A strong move past this could send Ethereum towards $3,000. Support levels are found at $2,450 and $2,300, which are vital for maintaining its current momentum. The RSI is at 68, indicating a strong bullish trend, but it's also approaching overbought territory, which might lead to a brief pause or small correction before further gains.
Technical Analysis of Ethereum Price Trend Outlook for June 7, 2025
Chainlink (LINK): Bullish Flag Signals Continuity
Chainlink (LINK) is in a mildly bullish trend as of June 7, 2025, trading roughly at $45. It has seen mild growth in the last 24 hours, and a bullish flag pattern is forming. This pattern often suggests that the prior upward trend will continue. The critical resistance zone for LINK is between $48 and $50. A breakout above this is crucial and could target $55. Support levels are at $42 and $39. The RSI at 57 confirms a mildly bullish trend, and the MACD also shows a bullish signal. For sustained upward movement, breaking the $48 resistance is key.
Technical Analysis of Chainlink (LINK) Price Trend Outlook for June 7, 2025
Sui (SUI): At a Crossroads, Awaiting a Breakout
SUI is at a critical juncture on June 7, 2025, trading around $3.28 with minimal recent volatility. Technical analysis reveals a symmetrical triangle pattern on the daily chart. This typically means a significant price movement is coming after a period of consolidation. Key resistance for SUI is between $3.47 and $3.73, while support levels are at $3.19 and $3.00. The RSI at 48 suggests a neutral trend but with bullish potential, and the MACD shows a neutral signal. A rise in trading volume and a clear break above the $3.47 resistance could confirm a mildly bullish path for SUI.
Technical Analysis of Sui Price Trend Outlook for June 7, 2025
Tron (TRX): Mildly Bullish, Facing Consolidation
TRON (TRX) is at a pivotal price point on June 7, 2025. Technical analysis indicates a mildly bullish trend, but it might consolidate due to resistance at $0.32. The key resistance zone for TRX is between $0.32 and $0.34, with support levels at $0.28 and $0.26. The RSI at 58 suggests a mildly bullish trend, and the MACD also shows a bullish signal. Investors should watch for a clear breakout above the $0.32 resistance to confirm sustained upward movement; otherwise, further consolidation might occur.
Technical Analysis of Tron (TRX) Price Trend Outlook for June 7, 2025
Cardano (ADA): Bullish Flag Points to Higher Prices
Cardano (ADA) is trading around $1.75 as of June 7, 2025, showing modest growth recently. Technical analysis identifies a bullish flag pattern on the daily timeframe, hinting at potential upward movement. Resistance levels are between $1.80 and $1.90, and a break above this could target $2.00. Support levels are at $1.60 and $1.50. Both the RSI and MACD indicators suggest a mildly bullish trend for ADA. Furthermore, the convergence of the 50-day and 200-day EMAs could signal a more significant upward trend soon, making ADA an interesting asset to monitor.
Technical Analysis of Cardano (ADA) Price Trend Outlook for June 7, 2025
Dogecoin (DOGE): Waiting for the Triangle Break
Dogecoin (DOGE) is currently trading around $0.35 on June 7, 2025, showing a weak bullish trend. Technical analysis reveals a symmetrical triangle pattern, which usually means a breakout is coming, though its direction is uncertain. The key resistance zone for DOGE is between $0.38 and $0.42, while support levels are at $0.32 and $0.29. Market sentiment is neutral, with the RSI at 53, indicating limited immediate growth potential. A decisive move out of this triangle will determine its next major price action, making it a volatile token to watch.
Technical Analysis of Dogecoin (DOGE) Price Trend Outlook for June 7, 2025
Solana (SOL): Bullish Momentum, Key Resistance Ahead
Solana (SOL) is showing a bullish trend as of June 7, 2025. However, breaking the $280 resistance is essential for continued upward movement. The key resistance zone is between $270 and $280, where selling pressure has previously halted its gains. A strong breakout above this level could push Solana towards $300, a major psychological level. Conversely, support levels are found at $250 and $230, vital for price stability during any pullbacks. The RSI at 58 indicates a mildly bullish trend with room to grow before becoming overbought.
Technical Analysis of Solana (SOL) Price Trend Outlook for June 7, 2025
Binance Coin (BNB): Bullish but Nearing a Strong Hurdle
Binance Coin (BNB) is currently trading around $945 on June 7, 2025, maintaining a bullish trend. However, strong resistance at $980 could lead to short-term consolidation. The key resistance zone for BNB is between $980 and $1,000, a significant challenge. Key support levels are at $880 and $850. The RSI at 63 reflects a mildly bullish trend, and the MACD also indicates bullish momentum. A definitive push past the $980-$1,000 resistance band is crucial for BNB to continue its upward trajectory.
Technical Analysis of Binance Coin (BNB) Price Trend Outlook for June 7, 2025
Ripple (XRP): Symmetrical Triangle Hints at Action
Ripple (XRP) is trading around $2.20 as of June 7, 2025, with limited recent volatility. Technical analysis reveals a symmetrical triangle pattern on the daily timeframe, suggesting an impending breakout. Key resistance levels are identified between $2.30 and $2.50, and a breach of these could lead to a target of $3.00. Support levels are at $2.08 and $1.90, where price reactions are expected during pullbacks. The RSI at 55 indicates a mildly bullish trend, with the MACD showing a weak bullish signal. For sustained upward momentum, a decisive break above the $2.50 resistance is paramount.
Technical Analysis of Ripple (XRP) Price Trend Outlook for June 7, 2025
Conclusion
As of June 7, 2025, the cryptocurrency market is a dynamic space, with a mix of bullish trends and critical technical tests. Many major cryptocurrencies like Bitcoin, Ethereum, Solana, and Binance Coin are showing positive signs, but they often face strong resistance that might lead to short-term consolidation. Meanwhile, assets like Dogecoin, Sui, and Ripple are forming symmetrical triangle patterns, indicating that a significant price move is on the horizon, though its direction is still uncertain. Understanding key technical indicators such as RSI, MACD, and support/resistance levels remains crucial for predicting future price actions. Keeping an eye on these signals is essential for making informed decisions in this rapidly evolving digital landscape.
About the Creator
blockenza
Your multilingual source for crypto insights — Technical analysis, fundamental reports, and real-time news in English, Persian, and Arabic.
Market Analysis (TA & FA)
Daily Crypto News
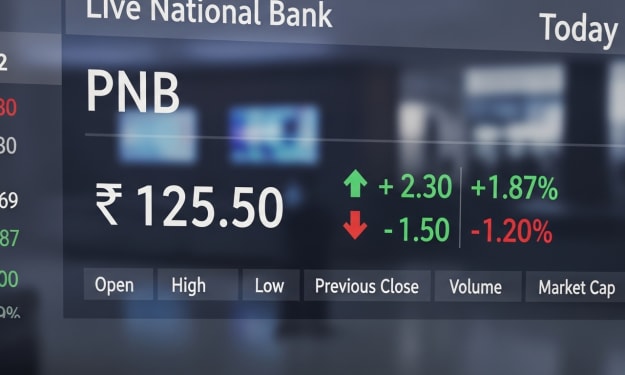
Live PNB Share Price Today – Latest Punjab National Bank Stock Updates
Are you looking for the PNB share price right now? This article gives you fresh insights, clear explanations, and easy‑to‑understand updates about the Punjab National Bank stock for investors and curious readers alike.
By Safdar meykaabout 19 hours ago in Trader


Comments (1)
Bitcoin's in an ascending triangle, looking bullish. Resistance is around $104,000 - $105,000. Ethereum's at a key point too, with resistance between $2,700 - $2,855. These trends are worth watching.