
Bullish Harami: How to Trade the Japanese Candlestick
A bullish harami is a candlestick pattern that indicates a potential for a bullish reversal. Discover how to use the pattern with the pros and cons.


Have you ever traded a bullish harami candlestick pattern?
Well, the term may look quite weird, but the pattern undoubtedly gets placed on the top candlesticks.
Wait, you don’t know how to use the bullish harami? Not to worry. In this Beirman Capital’s candlestick education series, we will today discuss the bullish harami pattern, how to use it with diverse strategies, pros and cons.
What is a Bullish Harami?
A bullish harami is a popular Japanese candlestick pattern that indicates a potential for a bullish reversal. It consists of two candles, one large and one small, and the second is completely within the body of the first candle.
A bullish harami pattern forms when the bears are in control, but the bulls manage to weaken the trends. It suggests to traders a potential for a price rise and indicates that they should open a long position in the asset.
How to Spot Bullish Harami Pattern
Struggling to identify a bullish harami pattern on the chart? Let us look at how to do so.
Shape: The word 'Harami’ means Pregnant woman in Japanese; the bullish harami patterns look like a woman with womb. Thus, the pattern got its name.
Candle: Bullish Harami pattern consists of two candles, the first one is long and bearish (red), and the second one is short and bullish (green). The body of the second candle lies entirely in the first candle.
Trend: A bullish harami pattern generally appears at the end of the downtrend. It indicates a change in trend from bearish to bullish.
How to Trade The Bullish Harami Pattern
Watch the trend and Identify the Pattern: You first need to monitor the existing trend. A bullish harami pattern appears during the end of the downtrend, so watch for it. Also, look for two Bullish harami candles with the same qualities, as we have discussed above, to spot the pattern.
Check the Volume: Once a bullish harami pattern appears on the chart, don’t be hurry to place trades. Checking the strength of the candlestick is a must before starting; thus, watch the volume. A bullish harami accompanied by increasing volume confirms its strength.
Plot Trading Indicators: When it comes to placing trades, you cannot solely make a trade decision based on the bullish harami. For the pattern confirmation, you need to plot indicators such as the Relative Strength Index, the Fibonacci Retracement, and Moving Averages. If the indicator interpretations favor the patterns, then the trader can consider placing trades.
Open a Long Position: Once you have confirmed the pattern interpretation, you can move away with placing trades. As the bullish harami pattern indicates a shift from upward to downward trend, you can open a buy position. Place the take profit and stop loss levels according to your risk-to-reward ratio. An R/R ratio of 1:3 is ideal for trading this pattern.
Bullish Harami Pattern Strategies
Traders can use the bullish harami pattern in different ways. Want to know how? Here are the strategies to trade these candlesticks:
Bullish Harami and RSI
One of the popular ways is to integrate the candlestick pattern with RSI. When during bullish harami pattern formation, the Relative Strength Index line moves below 30, it suggests oversold conditions. This means that both the RSI and the pattern are telling the same thing, and traders can open a buy position.
Bullish Harami and Moving Averages
Traders can even use the moving averages' golden cross strategy. A golden cross is when a 50 MA moves above a 200 MA, suggesting a potential for bullish trends. A bullish harami accompanied by golden is ideal to trade.
Bullish Harami and Bollinger Band
Bollinger bands have three bands: middle, upper, and lower. When the middle band touches the lower band, it suggests oversold conditions. So traders can even plot the Bollinger band on the chart. If the price moves in an oversold zone during a bullish harami formation, they can open a long position, expecting a reversal.
Bullish Harami and Fibonacci Retracement
Traders can even use Fibonacci's golden ratio strategy for using bullish harami effectively. The 38.2% and 61.8% of Fibonacci act as key price levels. When during a bullish harami occurrence, the price moves near these golden levels, it confirms the pattern finding, signaling traders to open a long position.
Bullish Harami and Candlestick Pattern
An occurrence of some candlestick pattern also supports bullish harami finding, and traders can even use the strategy for trading. A bullish harami accompanied by patterns such as hammer, morning star, and bullish harami is also an ideal to trade.
Advantages of Bullish Harami Pattern
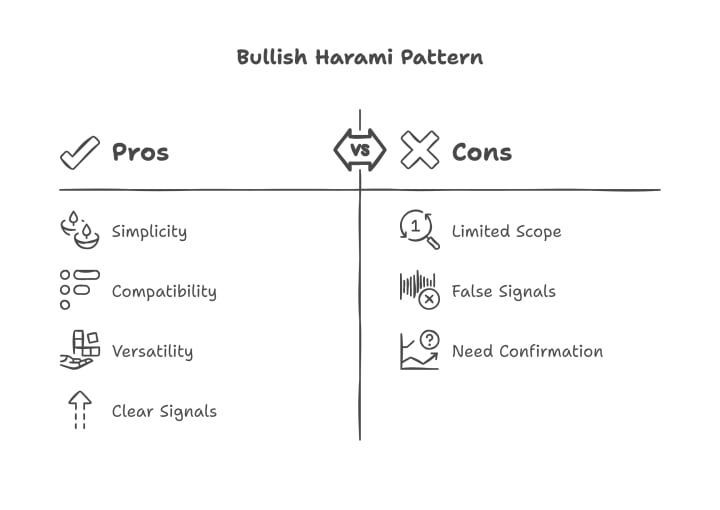
Simplicity: A bullish harami is not like other complex patterns with too many candlesticks. It just contains two candles, the first one big and red, and the second one small and green, which appear under the first candle's body. So, spotting it on the chart is relatively easy. Even beginners with a basic understanding of the pattern can spot it.
Compatible: As we have seen above, a bullish harami pattern can be used with indicators such as RSI, Moving Averages, Fibonacci, and Bollinger band. Also, you can even look for supportive candlestick patterns to interpret the strategy effectively. So, ultimately, the indicator is compatible with a wide range of strategies or chart patterns.
Versatility: Bullish harami is a universal pattern and can appear on the chart of any asset. You can identify trade opportunities in currency pairs, stocks, indices, cryptocurrencies, commodities, and other financial assets.
Clear Signals: Bullish harami provides a clear signal regarding the asset price movement. When the pattern indicates, it suggests that traders open a long position. So, the interpretation is clear, precise, and valuable.
Disadvantages of Bullish Harami Pattern
Limited Scope: As the pattern contains only two candles, it provides short-term trading opportunities. The bullish harami pattern is not suitable for long-term trading strategies such as position trading or buy or hold strategy.
False Signals: Like any other technical analysis pattern, bullish harami can also generate false signals. The probability of fake signals is higher during choppy or highly volatile markets.
Need for Confirmation: You cannot make trade decisions solely based on a bullish harami indicator. You must confirm the pattern by checking volume, plotting indicators, and using other chart patterns.
Bullish vs. Bearish Harami
You can confuse a bullish or bearish pattern with each, as they look exactly the same, but the interpretation is different. Let us compare both patterns to understand the difference:

A bullish harami appears during the end of the downtrend and indicates a potential for an uptrend reversal. It contains two candles, one large and one small.
The First is large and bearish, and the second is small and bullish. The second candle forms completely within the body of the first candle. It forms when bears are in control, but the bulls manage to weaken the trends. It suggests traders open a long position in the asset.
Meanwhile, a bearish harami appears during the end of the uptrend and indicates a potential for a downtrend reversal. It contains two candles, one large and one small.
The First is large and bullish, and the second one is small and bearish. Even in this pattern, the second candle also forms completely within the body of the first candle.
A bearish harami pattern forms when bulls are in control, but the bear manages to weaken the trends. It suggests traders open a short position in the asset.
Wrapping Up
No trading chart pattern or indicator is perfect; your approach makes it perfect. Bullish harami also has some pros and cons. When using the bullish harami pattern, get your basic clear, learn technical analysis and use confirmations.
Want to try the bullish harami strategy? Open an account with Beirman Capital and try diverse strategies on our platform.
FAQ
What does a bullish harami mean?
A bullish harami is a popular Japanese candlestick pattern that indicates a potential for a bullish reversal. It appears when a large bearish candle is followed by a small bullish candle.
What happens after bullish harami?
After a bullish harami pattern occurrence, a shift from a downtrend to uptrend is expected, suggesting traders take a buy position.
Is the bullish harami reliable?
Yes, bullish harami is a reliable pattern if used properly with confirmation with technical analysis indicators.
What does a bearish harami pattern indicate?
A bearish harami pattern indicates a downtrend reversal, suggesting traders take a sell position.
How accurate is bearish harami?
The accuracy of bearish harami depends on how effectively it is used. Proper confirmations and integration of technical analysis indicators can give good accuracy.
Which is more bearish, harami or doji?
Harami is more bearish, indicating a clear trend reversal. A doji suggests indecision in the market.
About the Creator
Beirman Capital
Professional Broker For Professionals
The Best Partner You Can Trust in Investment Execution
1. Competitive Spreads
2. Trading Instrument
3. Fast Order Execution
Keep reading
More stories from Beirman Capital and writers in Trader and other communities.
Dem Indicator & Demark: Indicator Marker In Demarking Strategy
Forex Trading Guide: The DeM (DeMarker) Indicator Explained Have you ever heard of the Dem indicator in trading? Well, it is undoubtedly a great tool for spotting buy or sell opportunities in a diverse market. And you should use the Dem indicator strategy at least once in your trading journey.
By Beirman Capital8 months ago in Trader
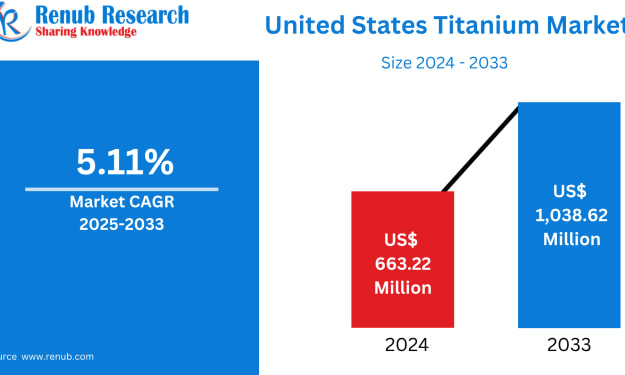
United States Titanium Market Size and Forecast 2025–2033
The titanium market within the United States is expected to grow considerably, from US$ 663.22 million in 2024 to US$ 1,038.62 million in 2033. This expansion reflects a healthy Compound Annual Growth Rate (CAGR) of 5.11% from 2025 to 2033, underscoring the increasing importance of titanium across modern industries. From aerospace engineering and defense manufacturing to medical implants and energy systems, titanium has become a cornerstone of high-performance materials.
By Aaina Oberoia day ago in Trader
The Role of Lexinova Ultra in Modern Financial Analytics
The financial technology (FinTech) sector has evolved rapidly over the past decade, reshaping traditional financial services and creating new opportunities for businesses and consumers alike. From digital payments and blockchain to artificial intelligence and algorithmic trading, FinTech is now a cornerstone of modern finance. Among the emerging tools supporting this transformation are advanced platforms such as Lexinova Ultra, which exemplify the integration of high-performance analytics and data-driven decision-making in financial markets. This report examines the current trends, technological advancements, and future prospects of the FinTech ecosystem, emphasizing innovations that drive efficiency, security, and accessibility.
By Lexinova Ultra5 days ago in Trader
Bruce Lee and The God of War: Kuan Ti
It starts with love.. The Power to the God Of War and Wealth Walk into a Chinese restaurant (even in Oklahoma, USA), a Chinese police station, a kung fu martial arts studio or even a Chinese temple and you often see a red faced warrior holding a heavy quan-do (spear like weapon).
By WILD WAYNE : The Dragon King4 days ago in Chapters


Comments
There are no comments for this story
Be the first to respond and start the conversation.