
Three things to consider before you dive into Metrics That Matter
Metrics That Matter Scenarios

Use the time frames that make the most sense for your startup. Generally, the longer the physical-channel sales cycle (think enterprise software), the longer the “space” between calculations should be.
Here we used a quarter-by-quarter forecast.
An analysis like this can—and should—often stop the pivot–or-proceed process in its tracks if the computation forecasts that the company will either run out of money within the year or won’t be able to raise enough funds to survive the first year of customer creation
Don’t be in a hurry at this critical step. As an entrepreneur, if you take a pile of money to move forward here and fail, it will at least cost you a significant portion of your founders’ equity, and it will often cost you your jobob.
Metrics that Matter Scenarios.
cenarios
Metrics matters are a radically new approach to startup math. They’re best illustrated with a series of examples. The three spreadsheet scenarios on the next pages illustrate how you can use “Metrics that Matter” to evaluate your business. The three examples are:
a physical product sold in a physical channel
a web/mobile product sold in the web/mobile channel
and a multisided web/mobile market
Metrics that Matter: Example 1
“EZ Gardener” in a Physical Channel
Let’s take a look at Table 6.1 what the metrics that matter for a physical channel would look like in spreadsheet form.
Here’s a simple example of a rough quarter-by-quarter cash-burn computation for our hypothetical $30 (suggested retail) EZ Gardener all-in-one gardening-tool set, sold in garden stores and by mass merchants. Our timing is the coming year. (The spreadsheet starts Day One of the customer creation process.)
A few things about the hypothetical business factored into the numbers above: This “friends and family” funded venture begins customer creation with $500,000 in the bank. Like most physical-channel marketers, EZ Gardener also promotes online. But they read this book, followed directions, and are “getting the most important channel right first,” so they’re not selling product online yet
In year two, as the product’s newness wears off, the price drops.
Product development was completed earlier offshore, so there are no more development costs until we see how this product sells.
Revenue never scales dramatically, since the market type is “resegmenting/niche market”
What Metrics Matter?
There are 11 metrics that matter in this spreadsheet. Following the lefthand column of the spreadsheet, let’s explore the origin of each number as well as its source a little more closely:
1. Total number of units sold: This number is estimated (ideally by quarter) from customer validation report cards used with buyers and channel partners. Compare these numbers with your estimates of total addressable (or if known, serviceable) market and your market share estimates. Use the two sets of numbers to estimate the number of units to be sold in each quarter. If customers make multiple purchases within a year, factor it in.
2. Average retail selling price: How much the consumer will pay, on average, for the product. This number, developed in the value proposition hypothesis, should be validated in the competitive analysis and throughout customer and channel validation conversations. It’s shown here as the price per unit and is often the average selling price, since retail pricing may vary by channel.
3. Gross sales across all channels: Total retail-dollar sales for the product per quarter. Relatively straightforward to compute, since the company is using only one sales channel. Remember to consider “guaranteed sale” situations where retailers can return unsold merchandise for full credit.
4. (Less) channel discount (40%): What percentage of the product’s retail price will the channel take as its cost of sales? Deduct it from the retail price and apply it to all channel revenue as computed in No. 3. We’ve assumed a fairly typical chain-store margin here. This revenue will never reach the company’s coffers, so deduct it now to get to net company revenue.
Channels are notorious for charging suppliers for advertising, promotion, and shelf space.
5. (Less) other channel costs: Channels are notorious for charging suppliers for advertising, promotion, and even shelf space. There may also be costs of independent sales reps or brokers who “sell in” merchandise to the channel. In the first year, the company may want to, or be forced to, purchase special promotions in order to get shelf space in an important retail channel. Estimate these costs based on channel-partner discussions.
6. NET COMPANY REVENUE: The net channel revenue (No. 6) is the Gross Sales (No. 3) minus the channel discount (No. 4) and other channel cost (No.5).
7. (Less) sales costs (reps, trade shows): How much does it cost the team to reach the garden product channel cost? In addition to specific customer acquisition costs, the company will spend money on a sales force, sales and marketing materials, attendance at trade shows and more. These costs should be identified in the customer-relationships box and perhaps also in the cost structure box.
8. (Less) product costs: What does it cost to build and make the product? Developed primarily from the value proposition and cost structure boxes, this is an estimate combining two sets of costs:
• in this example the cost of developing the product is fully paid for
• the manufacturing cost of the physical product itself
9. (Less) current operating costs: Compute the costs of “turning on the lights” at the company every day, which should be a relatively static number: meager founder salaries, other payroll, rent, equipment, utilities, legal, and the like. This number usually shifts the least, so worry about it less than others. The spreadsheet increases it modestly late in the year and in the second year, as is typical.
10. CASH BURN FOR PERIOD: Did we make or lose money this quarter? How much? Start with the net company revenue (No. 6) and subtract all the costs beneath it, Nos. 7, 8, and 9. The result of that equation is the “cash burn,” or the reduction in the company’s bank account each quarter. In the example above, the company is losing money, or “burning cash,” until the fourth quarter, when customer growth and reduced product-development costs improve the company’s cash flow quite dramatically.
11. CASH REMAINING: Start by counting the money in the bank on Day One of the quarter. Our hypothetical company began its first year of customer creation with $500,000 in the bank. Reduce it by the quarter’s cash burn to determine how much will be left at quarter’s end.
If These Were Your Numbers, What’s a Founder to Do?
This is a “nice little business,” and while it will make a lovely living for its founders and a nice return for its investors, it’s hardly a scalable business like the many heroes of Silicon Valley. But even though this company is returning as much pretax profit in year two as it had in the bank on day one of year one, it’s basically going nowhere fast. It’s a one-product company, and the only way it got strong revenue growth was by reducing its retail price—never a good sign.
Some things the founders and board should really be discussing:
Are there any potential dramatic changes to the business model that can have significant impact on the company’s future growth prospects?
What about overseas markets? Are they a growth opportunity?
How can the company capitalize on its one modest success. Are they building a brand enough, and creative enough, to perhaps launch other products both in and beyond the garden area. They might start with “EZWeeder” and “EZhoe” first, and perhaps expand to “EZgrass” or “EZflowers” to take maximum advantage of their brand, credibility and channel relationships to scale the company broader and faster?
Can they extend beyond the garden, maybe adding “EZcooker” or “EZcleaner” or “EZcleanup” perhaps? Regardless of the new products, the company would need to spend some serious product development dollars and spend heavily on marketing (especially if moving beyond the garden) with no assurances of further success. (They actually need to develop a
whole new set of hypotheses)
Unless the company invests in new product development, this business is more of a hobby than a scalable business
Hold these thoughts—and others—for the final section of this phase, the pivot-or-proceed discussion. Next, look at the second of three business models for a software product sold in the web and mobile channels.
Metrics that Matter:
Example 2
Expense Reporter Sold via Web/mobile Channels
Let’s take a look at Table 6.2, another $30 retail product, downloadable XpensePro software, sold through the web/mobile channels only.
In this scenario, our hypothetical company is selling XpensePro only as a web or mobile app download directly from its website and via app stores. As in the previous example, things are factored into the numbers above:
Product-development cost is heavy at first and then declines.
Incremental product unit costs are practically zero, since the product is a download.
Revenue never scales dramatically, since the market type is “resegmenting/niche market,” but the year-to-year revenue increases are significant enough to promise downstream success
This angel-funded business starts with $300,000 cash remaining. More money will be hard to get.
What Metrics Matter?
There are five metrics that matter in this spreadsheet:
• Revenue comes from three channels.
Direct revenue from web sales, net of acquisition cost.
Direct mobile sales revenues, after subtracting referral incentives Revenue from the appstore channel, after subtracting channel fees and marketing costs
• Cash burned or made during the period
• Cash remaining at the end of the quarter
Because the business is operating in three distinct channels, each of which operates differently, it takes 17 different numbers to create the above five metrics, but the board just needs to focus on five rather than 17. If one’s ever out of whack or way off budget, drill down into the supporting details numbers that make that number up: unit sales, gross direct revenue, cost of customers or sales, and net revenue from the channel.
Following the lefthand column of the spreadsheet, let’s explore the origin of each number and its source:
Web Sales:
1. Direct web unit sales: How many web apps are downloaded from the company’s site. Customers are unlikely to make multiple purchases within a year.
2. Gross direct revenue: Multiply the number of units (No. 1) by the average selling price of $30.
3. (Less) customer acquisition cost: The cost to make a sale over the web On average, $6 worth of AdWords, incentives, e-mail and the like to acquire one customer. Multiply $6 by the number of solid units (No. 1).
4. Net web revenue total: Subtract the customer acquisition cost (No. 3) from the gross direct revenue from website sales (No. 2).
5. Direct mobile unit sales: A few customers will find and download the app’s mobile version at the company website (most will find it at the app stores). Calculate the quarterly units using the process described in EZ Gardner metric #1.
On the surface, this looks like a really lovely business.
6. Gross revenue/direct mobile units: Multiply the number of mobile units sold directly to customers (No. 5) by $30, the average selling price.
7. (Less) referral incentive: The customer-relationships hypothesis indicates that a third of the company’s direct sales will come from referrals by happy customers encouraged by a $4 incentive. Take 1/3 of the directsales web (No. 1) and mobile (No. 5) units and multiply by $4.
8. DIRECT mobile revenue total: How much cash winds up in the company’s bank from this channel? Multiply units (No. 5) by revenue/unit (No. 6) and then subtract the referral incentive (No. 7) to find the answer.
9. CHANNEL appstore sales (units): Calculate units using the channel method outlined in EZ Gardner unit sales #3.
10. CHANNEL gross revenue: multiply the channel units sold (No. 9) by the retail price of $30.
11. (Less) market/appstore 30% fee: Every download sold will cost the company an app store fee of 30 percent, or $9. Multiply units (No. 9) by
$9.00 and subtract it from channel revenue (No. 10).
12. TOTAL NET APPSTORE revenue: Subtract the appstore fee (No. 11) from channel revenue (No. 10) to find the amount of cash that will wind up in the company’s bank from appstore sales.
13. TOTAL NET revenue (all channels): Add three revenue numbers—No. 4 (direct web revenue), No. 8 (direct mobile revenue), and No. 12 (net channel revenue)—to compute the company’s net sales.
14. (Less) product/product-development costs: What does it cost to build and make the product? Compute your ongoing product development costs, plus download and bandwidth charges. There’s no physical cost of the product itself.
15. (Less) current operating costs: Compute the costs of turning on the lights at the company every day, as in Example 1, line 9.
16. CASH BURN FOR PERIOD: Did we make or lose money this quarter? How much? Follow the process for calculating cash burn outlined in Spreadsheet 1, line 10.
17. CASH REMAINING: Follow the process in Spreadsheet 1, No. 11.
If These Were Your Numbers, What’s a Founder to Do?
On the surface, this looks like a really lovely business. It plans to generate
$746,000 in positive cash flow in its first year of customer creation, and to roughly triple that cashflow in its second year. But can a business doing $2.5-million in revenue after four years really make investors and founders happy? That’s not for us to decide, and the numbers don’t tell us whether they spent $500,000 and a year—or $5,000,000 and five years—to get to the start of the spreadsheet, so it’s hard to applaud or bash the outcome. Seems like the next board meeting should pull out the latest business model canvas and look for some game-changing growth opportunities, almost no matter what. The company isn’t spending all that much money on product development or staff costs (those numbers are relatively flat), and it’s almost turning into a cash cow long before it should be turned out to pasture.
After all, almost any business that can get almost 100,000 new customers in
a year should be trying to figure out how to either add a zero to that number in a year or two, or at least double it, perhaps, in the second year. The company’s year two plan seems unambitious at first glance, even though the profits double.
Meanwhile, on the downside:
The $4 incentive (No. 7) might deliver too few sales and need to be beefed up, changing net revenues adversely
Appstore (No.12) approval process could delay launch in the biggest channel, hurting revenues.
More staff (No. 15) might be needed for support, channel relations, or who-knows-what.
Mobile sales direct to consumers (No. 5) could be a total flop, hurting that revenue
Even though the numbers look pretty good in the spreadsheet, hold the high-fives and look at ways to improve them anyway. After all, they’re still estimates based on customer validation proof—they’re not money in the bank by any means. Review the “what’s a founder to do” section under Spreadsheet 1 to explore ways to reduce the cash burn where it makes sense. Hold all these thoughts—and others—for the final section of this phase, the pivot-or-proceed discussion.
Metrics that Matter: Example 3
A Multisided Market Example
Here’s a third way to look at a totally different business model for the exact same product, XPensePro software. Let’s explore a multisided market, where the product is identical but it’s absolutely free to users. Advertisers eager to reach businesspeople with active expense accounts will pay to reach the audience, and company revenues come from advertising and sales of e-mail lists, the other “side” in this multisided market example.
A multisided market, where the product is identical but it’s absolutely free to users.
In this scenario, our venture-backed multisided market company is offering its products to users for free, provided that they agree to receive two e-mails per week from advertisers. The product is a digital download, but considerable resources are expended selling ads to the other side of the market. (It’s interesting to note how dissimilar these metrics that matter are when compared with the other two business models.) As in the previous example, several things are factored into the numbers above:
Our VC-backed example has a $10-million war chest Product-development cost is heavy at first and then declines
Product costs are practically zero, since the “product” is a download.
Revenue never scales dramatically, since the market type is “resegmenting/niche market,” but the year-to-year revenue increases are significant enough to promise downstream success. Much of the cost of advertising and e-mail sales is factored into the revenue numbers, which are net of network or rep commission costs. It still costs real money to acquire users through PR, e-mail, and other activities, even for a free product. As the company iterates and becomes smarter, its acquisition cost declines in the second year.
Metrics that Matter/Add It All Up
There are 16 “metrics that matter” in this spreadsheet because we need to monitor revenue and costs on both sides of the multisided market. (The company pivoted and eliminated cash sales of its product in this scenario.) Following the lefthand column of the spreadsheet, let’s explore the origin of each number as well as its source a little more closely:
1. New activated users : How many people will download the free app and begin actively using it. Active is defined as generating at least the average number of page views (No. 4).
2. New user acquisition cost @ $3: On average, the customer acquisition costs to generate one active user (No. 1). Some will come virally for free, others will cost $6 or more.
3. Total active users: Average active monthly users during the quarter.
4. Average page views per user per quarter: Actual user clicks on the site will generate this number by dividing the number of active users (No. 3) into total page views (No. 5). This is an important measure of the business health and growth.
5. Total page views per quarter: Multiply the total users (No. 3) by the average page views per user (No. 4) to begin to understand available advertising-sales opportunities for the period.
6. Less attrition: Lots of users abandon things they download but don’t have to pay for, so watching this number (generated by instrumentation) is important. We’ve defined attrition as a user who hasn’t generated a page view a week for two consecutive months.
7. TOTAL CPMs to sell: subtract attrition (No. 6) from total page views (No. 5) and divide by 1,000 for the “salable CPMs” needed (ad sales are based on cost per thousand, or CPM). The +/- 7% average gets worse in year two as more competitors emerge.
8. Average CPM x 4 ads/page: Competitive analysis and “buy-side” customer validation research will determine what CPM advertisers are willing to pay to reach this audience. Assuming four ads on each page, multiply the average
CPM by 4 to compute the average revenue per 1,000 pages viewed. In this example, we’ve already deducted the cost of sales, whether it’s commissions for sales reps or network ad sales. The CPM increases (Q3-4) as the site gets more attractive to advertisers.
9. TOTAL ADVERTISING REVENUE: multiply the number of M’s (No. 7) or total CPMs available for sale by the 4x average CPM (No. 8) to compute advertising revenue. The figure grows dramatically as the number of users and their site traffic rise.
The business model looks so strong and compelling...
10. E-mail-list rental revenue: An estimate based on competitive analysis and buy-side customer validation research. This starts out small and at very low rates (per thousand) and, both CPM and volume build as the audience becomes large enough to be attractive to advertisers.
11. TOTAL REVENUE: This ad-supported multisided marketer has only two sources of revenue. Add the advertising revenue (No. 9) to the e-mail-list rental revenue (No. 10).
12. (Less) user acquisition cost: Subtract the number from Line 2 here.
13. (Less) product/product-development cost: Computed from customer validation and cost structure boxes of the business model. While this declines later in the first year as the initial product matures, the budget increases in the second year to add features that will help the company continue attracting new customers.
14. (Less) current operating costs: Compute the costs of turning on the lights at the company every day, as the EZ Gardner example, line 9 on page 442.
15. CASH BURN per period: Subtract the three cost centers (Nos. 12, 13 and 14) from the total revenue (No. 11) to compute the quarterly cash burn.
16. Cash remaining/end of quarter: Subtract the cash burned (or collected) during the quarter from the checkbook balance as of the first day of the quarter to calculate the cash remaining at quarter’s end. This number becomes attractive rather quickly in this model.
If These Were Your Numbers, What’s a founder to do?
There’s an old rule in startups that a spreadsheet is worth 48.5x the paper it’s printed on. But if this spreadsheet set of “metrics that matter,” is anywhere close to accurate, our founders and investors at Expensereporter may indeed have a homerun on their hands.
In this case, the business model looks so strong and compelling that the founders have two clear priorities. Job #1 is to play strong defense, and make certain that they deliver on all the key numbers in the plan (which, as you recall, are already turned into immutable facts through two grueling stages of Customer Development). That process starts with a step-by-step revalidation of every single number on the page, to be sure there are no mistakes. Next step: a detailed “worst case” analysis.
As every business should, the founding team here should expand this one set of metrics into three: a worst case and a high case, on both sides of the hypothetical set of metrics shown here. And since the business is totally dependent on advertising revenue, they should quickly return to their channel validation efforts and probe further to make sure they’re as valid as everyone believes. They should also focus on reducing user attrition.
With all that accomplished, review the analyses from Spreadsheets 1 and 2 about reducing costs and optimizing activation and revenue. Then, just in case, put a case of great French Champagne in the office fridge!
Some Final Thoughts About the Financial Model
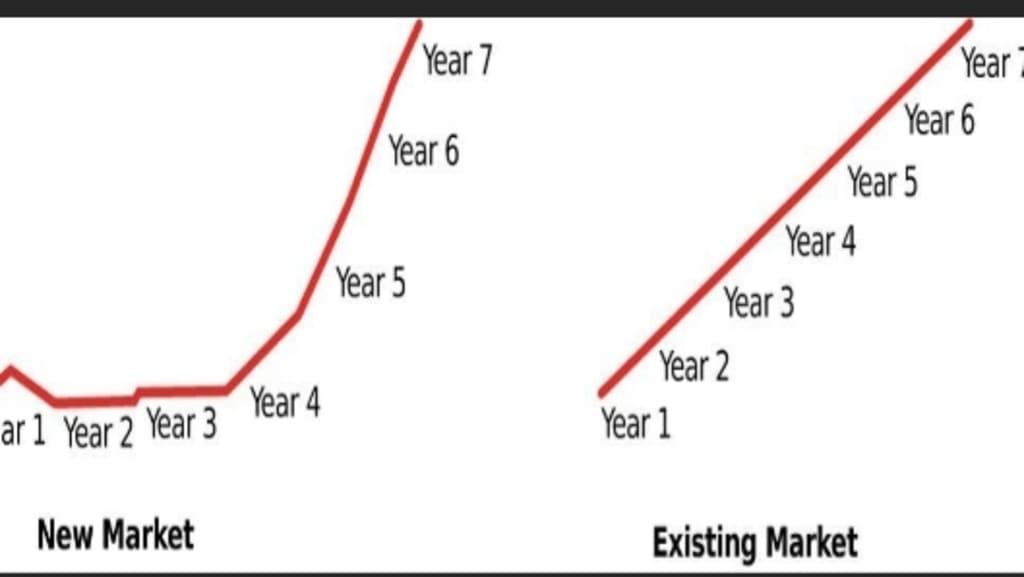
Market Type Affects Revenue Streams. Each of the four market types has a distinctive sales-growth curve shaped by the degree of difficulty involved in transitioning from sales to the earlyvangelists to sales to mainstream customers. Obviously in new markets, it typically takes considerable time for the product to catch on beyond earlyvangelists, who aren’t typically high-volume mainstream buyers. So success with early sales doesn’t guarantee fast revenue scaling. The sales-growth curves for a new market and an existing market graphically illustrate the difference. Even after finding and successfully selling to earlyvangelists, the rate of sales differs in later years because of the different adoption rates of mainstream customers.
Estimating revenue in an existing market is relatively simple: Look at the incumbents and calculate the increasing percentage of market share the startup will grab each year.
Estimating a new market’s size might seem impossible, since it doesn’t exist yet. What to do? Estimate the opportunity based on proxies and adjacent markets. See if there are any comparable companies. Have others grown as fast as the estimate? Why will this startup perform similarly?
The sales curve in a resegmented market is somewhat easier to estimate. It’s generally similar to that of a new market in that it takes time to gather a head of steam. There are three steps to assessing a resegmented market: assess the size of the existing market, figure out how large your startup’s “segment” is, and calculate the adoption rate, or the time it will take for that segment to recognize the new product as the solution of choice. Count only the segment that will switch, and beware of long-term contracts, service contracts, and “sunk costs” such as training and installation, all of which are often “lockins” or hidden barriers to switching.
About the Creator
Keep reading
More stories from Daniel Joseph and writers in Journal and other communities.
Revenue growth curves depend on Market Type!
Demand Curve Affects Revenue: The “demand curve” seeks the optimum intersection between sales volume and net profit. For example, if a physical product is most efficiently manufactured in lot sizes of 5,000, can that inventory be sold in a reasonable time when current unit sales are 50 a month? A startup selling new electric cars for $29,000 will generate massive demand. But if they cost $45,000 to manufacture, the company will go bankrupt very quickly. Consider: The actual price per unit, for multiples, and for subscriptions how pricing can be used to attract more users. How pricing can create larger or more frequent purchases by the same user; volume discounts, free shipping, loyalty points and similar pricing mechanisms are used for what’s typically called “market basket” optimization. How pricing can be used to enhance profitability or volume How the company can forward-price the product to intersect the economies-of-scale curve (as in, “If we could build 10,000 at a time, our production cost drops 32 percent”)
By Daniel Joseph 4 years ago in Journal
Who is your "Person"?
It's important to recognize that you cannot go through life as easily on your own. My name is Elizabeth and I'm a survivor of child abuse and horrific trauma. Healing from trauma is not a quick fix and recognizing that it will take time, is part of the struggle.
By Elizabeth Woods5 days ago in Psyche


Comments
There are no comments for this story
Be the first to respond and start the conversation.