
Personalize User Experience with Machine Learning
Create segments of users based on their purchasing power using K-Means clustering


Introduction
The goal of this analysis was to identify different user groups based on the deals they have availed, using a discount app, in order to re-target them with offers similar to ones they have availed in the past.
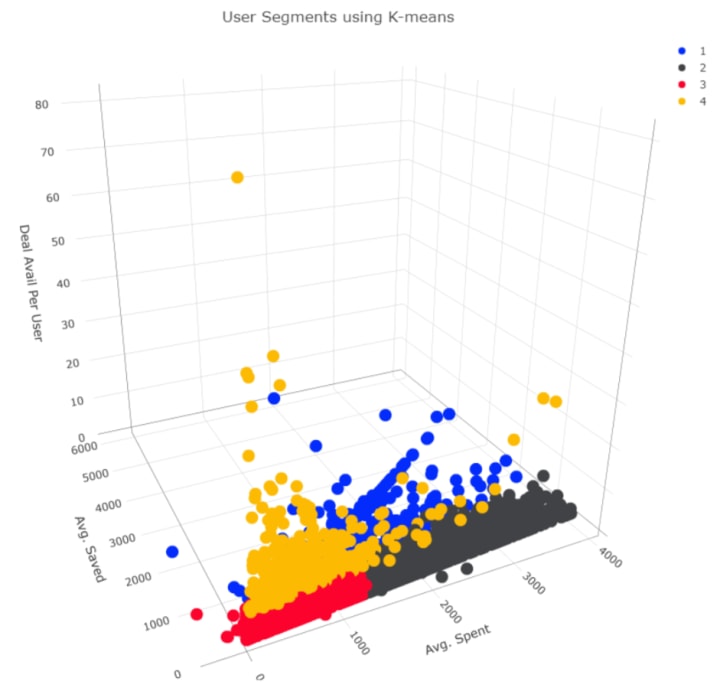
Machine learning algorithm K-means was used to identify user segments based on their purchase behavior. Here is a 3-D illustration of what algorithm extracted.
Terminologies
Before going deeper into the analysis, let’s define some keywords being used.
- Deal Avail: When user avails discount using app.
- Spent: Discounted price user pays while buying an item.
- Saved: Amount user saved through the app.
- Brands: Vendors for which discounts are being offered such as Pizza Hut, KFC
- Deals: Discounts offered to users on different outlets and brands.
Analysis
Datasets
The behavior data set was extracted from Mixpanel using JQL. The Following was used for this analysis.

- userId: unique id of user
- saveAmount: amount saved by user on deal avail
- spentAmount: amount spent by user on deal avail
- brandName: brand for which deal was availed
- count: number of deals availed by user
Using the above data set averageSpentAmount, averageSavedAmount and dealAvailCount was calculated for each user as seen below

Machine Learning — K-means Clustering
The first step of the k-mean algorithm was to find an optimal number of clusters for segmentation. There are a number of methods out there for this purpose, one of which is the elbow method using within-cluster sum square (WCSS).

Based on the elbow method, 4, 5, and 6 clusters were used to explore the segments and 4 clusters were picked as best for the given data set.
kmeansCluster <- kmeans(dataset,4)
if you want to learn more about user clustering and user segmentation I would recommend these courses on Coursera and Datacamp.
What Segments K-means extracted?
Following were average stats of four identified segments:
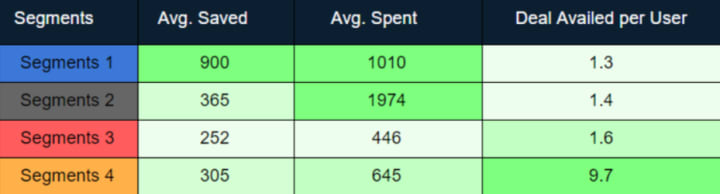


Users in segment 1 and 2 were high paying users with segment 1 users also had saved equally high per deal(probably availed buy 1 get 1 offers). However, the number of deals availed by these users were less than 2 (i.e. 1.3 and 1.4 respectively).
On the other hand, segment 3 and segment 4 users spent less and hence, saved less as well. However, segment 4 users had the greatest deal availed per user ratio (on average more than 9 deals availed by each user) in all 4 segments. It was the most converted cohort of users.
What were the total number of users and the number of deals availed in each segment?
Here is the total number of users and deals each segment users had availed.


57% of users belonged to segment 3 and only 3% of users were from the most converted segment (i.e segment 4).
What were overall users spending?
Here is the spread of spending by each segment

Some of the users from segment 4 had high spending (yellow dots in segment 4) similar to segment 1 and 2 but segment 3 (which comprise of 57% of the users) didn't go for high spending deals and/or brands at all.
Type of brand each segment users preferred?
Let’s look at what type of brand these segment users avail to understand any distinction in them.

Segment 1 users had availed mix of burger, pizza and fun time, Segment 2 users had availed pizza and segment 3 users had preferred burgers. While Segment 4 users (most converted users) preferred juices and other types of brands.
What brands each segment availed?
Here are the top 10 brands these segmented users had availed.

Looking at the brands we can comprehend what type of brand and deals these segment users would prefer. Segment 1 & 2 users (high paying users) had availed premium brands such as Sajjad, kababi, Charcoal, California, etc while segment 3 and 4 (low paying users) had mostly opted in for medium to low tier brands.
How these results can be employed?
Based on different user segments we can:
1- Targeted Ads
Personalize ads for each segment would increase the conversion rate as users are more likely to convert on specific brands and offers. So, for example, show Sajjad’s ads to users with higher-paying power then to users with low paying power.
2- In-app Recommendations
Optimize the app to recommend deals and discounts within the app that each segment users would be more interested in.
Summary
To sum up, with data and proper efforts we were able to identify interesting information about users and their liking and were able to strategies how to engage users more based on their preferences.
About the Creator
Keep reading
More stories from muffaddal qutbuddin and writers in Futurism and other communities.
About Binding Prometheus
I want to start actively advocating on behalf of my own work, and the most valuable part of my canon is, without a doubt, Binding Prometheus, the play I have been working on since 2019 and only finished in 2023 as part of my MA. The play itself is an amalgamation of a million different inspirations. On one end, it evokes the Ancient Greek myth-play, deriving its own title from the earliest extant work of Western drama we have, Aeschylus’s Prometheus Bound. On the other end, it borrows significantly from the sci-fi bulwarks from over the years, namely Mary Shelley’s Frankenstein and Karel Capek’s Rossum’s Universal Robots. The play could be an episode of Black Mirror, I fear. I don’t know. I’ve only ever seen one episode of Black Mirror.
By Steven Christopher McKnight14 days ago in Futurism


Comments
There are no comments for this story
Be the first to respond and start the conversation.