
What Are Trading Indicators? A Friendly Guide for Beginners
What are the best forex trading indicators

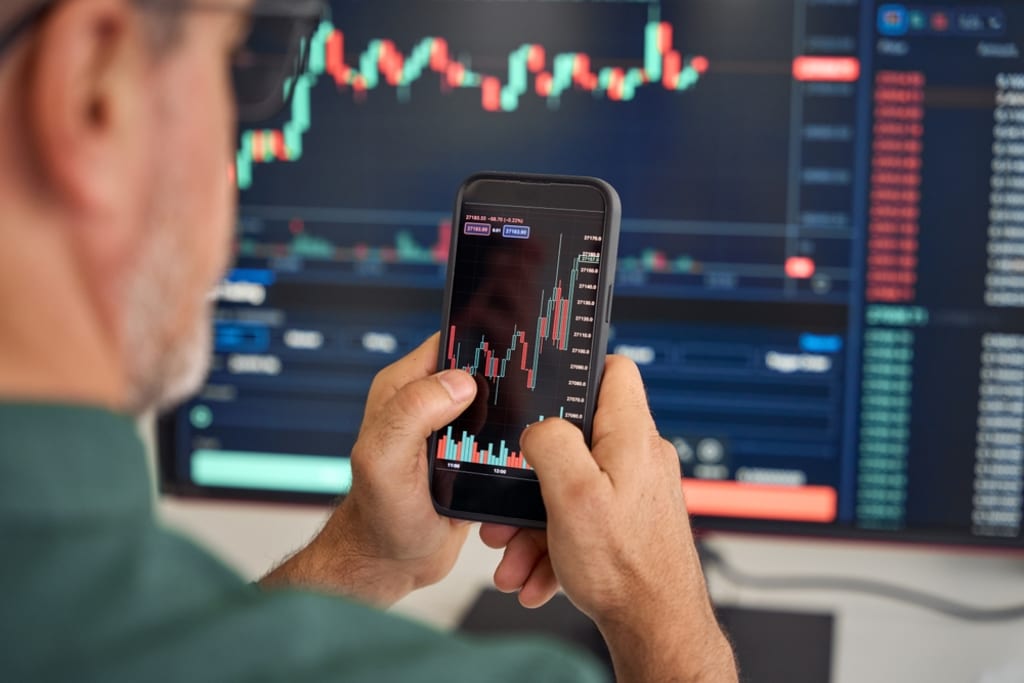
Hi there, hope you are doing well, if you’re getting into the world of trading, you’ve probably heard about term “trading indicators.” Sound suspicious, right? Don’t worry — I’m here to tell you about.
These trading indicators work as your personal assistants in the financial market. They’re tools that help you analyze price movements, spot trends, and help you to enhance your trading abilities. Let’s know about it what they are and how they can become your helping trading tools and will tell you about some best forex trading indicators.
Why Use Trading Indicators?
Imagine you’re trying to find a location in the city without a map. It’s hard to find a place without information, isn’t it? without trading indicators tools is kind of like that. Indicators provide:
• Clarity: They show patterns and trends in what might seem like random price movements.
• Confidence: They back up your trading decisions with data.
• Timing: They help you figure out the best moments to buy or sell.
Types of Trading Indicators
Trading indicators come in all shapes and sizes, but they generally fall into four main categories:
1. Trend Indicators
These help you identify the overall direction of the market (up, down, or sideways). Examples include:
• Moving Averages (MA): Smooth out price data to highlight trends.
• Average Directional Index (ADX): Tells you how strong a trend is.
2. Momentum Indicators
If want to know how price is changing rapidly? Momentum indicators measure the speed of price changes. Examples include:
• Relative Strength Index (RSI): Shows if the market is overbought or oversold.
• Stochastic Oscillator: Another tool to check if prices are in extreme zones.
3. Volume Indicators
Volume is the fuel of the market. These indicators show how much trading activity is happening. Examples include:
• On-Balance Volume (OBV): Measures buying and selling pressure.
• Volume Weighted Average Price (VWAP): Combines price and volume for a clearer picture.
4. Volatility Indicators
These show how much price swings you can expect. Examples include:
• Bollinger Bands: Highlight periods of high and low volatility.
• Average True Range (ATR): Measures how much the price moves on average.
How to Use Trading Indicators
Here I am telling you some important rules: Keep it simple. Don’t confuse yourself with a dozen indicators. Start with one or two that match your trading style. For example:
• If you’re a trend trader, use Moving Averages.
• If you’re a short-term trader, try RSI or Stochastic Oscillator.
Our goal is to use indicators to see what going on the chart. They’re not crystal balls, but they’re excellent guides.
Common Mistakes to Avoid
1. Relying on Indicators Alone: Indicators are tools, not guarantees. Combine them with other analysis methods.
2. Overloading Your Chart: Too many indicators can create confusion instead of clarity.
3. Ignoring Market Context: Always consider the bigger picture, like news events or economic data.
Conclusion
On your trading journey, trading indicators are similar to road signals. They will assist you in making better decisions and avoiding bad turns, but they won't do trading for you.
Which trading indicators are you excited to try? Happy trading, and please share your thoughts in the comments section below about indicators experience!
About the Creator
Ethan Williams
I am an experienced trader who has spent over many years working in the financial markets and I have developed strategies that work well over time. I like to share what I know, giving helpful tips and advice to make trading easier.
Keep reading
More stories from Ethan Williams and writers in Education and other communities.
Zomato Share Price and Its Impact on Gold Trading
Zomato has been a significant force in the food delivery industry in recent years. Investors are paying attention to its share price, and many are examining its wider effects on financial markets, including unanticipated domains like gold trading. We shall examine the connection between the movement of Zomato's share price and gold trading in this blog.
By Ethan Williamsabout a year ago in Education
The Day Gravity Failed for 9 Seconds
At 11:42:17 a.m., the world loosened its grip. There was no warning siren. No emergency broadcast. No flicker in the sky or tremor in the ground. One moment, the Earth was doing what it has always done — holding oceans in their basins, keeping feet on sidewalks, anchoring coffee in cups — and the next moment, it wasn’t.
By Abubakar2206 days ago in Education
How the Sun Generates Energy: The Complete Guide to Solar Power Production
What Is the Source of the Sun’s Energy? The Sun generates energy through a process called nuclear fusion. Unlike Earth-based power plants that burn fossil fuels, the Sun does not rely on chemical reactions. Instead, it uses nuclear reactions that occur deep inside its core.
By shahkar jalal3 days ago in Education
Who is your "Person"?
It's important to recognize that you cannot go through life as easily on your own. My name is Elizabeth and I'm a survivor of child abuse and horrific trauma. Healing from trauma is not a quick fix and recognizing that it will take time, is part of the struggle.
By Elizabeth Woods4 days ago in Psyche


Comments
There are no comments for this story
Be the first to respond and start the conversation.