
Understanding Silver Price Trends: A Comprehensive Guide to Reading Silver Price Graphs
In this comprehensive guide, we will delve into the intricacies of silver price trends and how to interpret price graphs effectively.
Understanding Silver Price Trends: A Comprehensive Guide to Reading Silver Price Graphs
Silver, as a precious metal, has long been a vital component of global financial markets. Its value fluctuates based on a variety of factors, including economic conditions, geopolitical events, and investor sentiment. Understanding silver price trends and how to read price graphs can provide valuable insights into market dynamics and aid in making informed investment decisions. In this comprehensive guide, we will delve into the intricacies of silver price trends and how to interpret price graphs effectively.
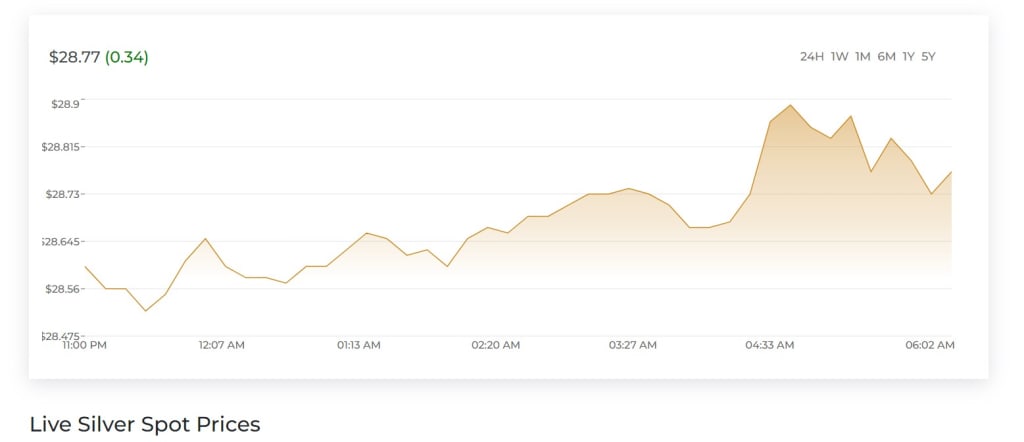
Current Silver Prices
As of July 31, 2024, the price of silver stands at $28.73 per ounce, reflecting a recent increase of $0.38. This equates to $0.92 per gram, $923.71 per kilogram, $1.44 per pennyweight, $10.77 per tola, and $34.91 per tael. These values highlight the various ways silver is priced in different units, catering to diverse market needs. The recent increase in prices suggests a positive shift in silver's market performance, potentially influenced by global economic factors or market demand.
Historical Price Trends
To gain a deeper understanding of silver price movements, examining historical data is crucial. The following analysis covers silver's average closing prices, opening values, highs, lows, and annual percentage changes over the past few decades:
In 2024, the average closing price of silver was $26.63, reflecting a significant increase from the previous year. The price opened at $23.84, reached a high of $32.50, and touched a low of $21.94 before closing the year at $28.38, marking a 19.09% increase. This notable rise illustrates a period of growth and recovery in silver prices, influenced by various market conditions.
The year 2023, in contrast, saw a slight decrease in silver prices, with an average closing price of $23.41. The year began with a price of $24.02, peaked at $26.14, and fell to $19.90 before closing at $23.80. This resulted in a marginal decrease of 0.93%, indicating a year of relative stability with minor fluctuations.
Looking further back, 2022 presented a moderate increase with an average closing price of $21.79. The year opened at $23.30, reached a high of $26.92, and dropped to a low of $17.57, closing at $23.97, a 2.88% rise. This performance reflects a year of gradual improvement despite fluctuations.
Conversely, 2021 experienced a decline with an average closing price of silver $25.13. The price began the year at $26.85, peaked at $30.04, and fell to $21.35, closing at $23.32, marking a significant decrease of 13.16%. This downturn highlights the volatility and impact of external factors on silver prices.
The year 2020 was marked by a substantial increase in silver prices, with an average closing price of $20.53. The year saw a low opening price of $17.86, a high of $29.86, and a low of $11.67, closing at $26.38, an impressive 47.7% increase. This surge can be attributed to the economic uncertainties and market shifts caused by the COVID-19 pandemic.
Interpreting Silver Price Graphs
Reading silver price charts involves analyzing several key elements to understand market trends:
Price Trends: Observe the general direction of silver prices over time. An upward trend indicates rising prices, while a downward trend suggests a decline. Look for patterns of consistent growth or decline to gauge market sentiment.
Support and Resistance Levels: Identify levels where silver prices have consistently found support (bottoms) or faced resistance (tops). These levels can provide insights into potential price movements and market stability.
Volatility: Assess the extent of price fluctuations within a given period. High volatility indicates significant price swings, while low volatility suggests more stable prices.
Annual Percentage Change: Analyze the year-over-year percentage changes to understand the overall performance of silver. Significant changes may indicate shifts in market conditions or investor behavior.
Historical Context: Compare current prices with historical data to contextualize recent movements. Understanding past performance helps in predicting future trends and making informed investment decisions.
By examining these factors, you can gain a comprehensive understanding of silver price trends and make better investment choices. Silver's dynamic nature requires constant monitoring and analysis, but with the right tools and knowledge, you can navigate the market effectively and capitalize on potential opportunities.
In conclusion, understanding silver price trends and reading price graphs are essential skills for anyone interested in precious metals. By analyzing current prices, historical data, and key market indicators, you can gain valuable insights into silver's performance and make informed investment decisions. Keep abreast of market developments and use historical context to guide your strategies for optimal results.
About the Creator
Keep reading
More stories from Lakhwinder Singh and writers in Education and other communities.
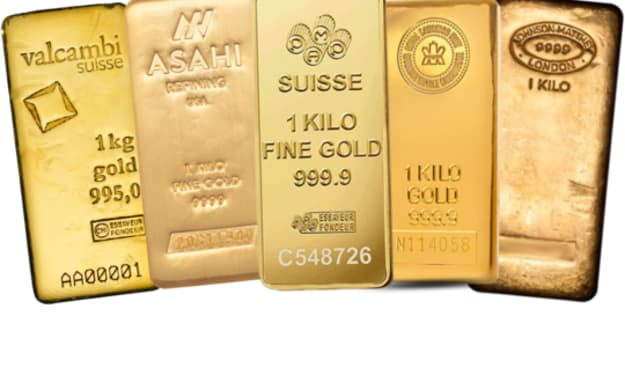
Understanding the Value: How Much Is One Kilo of Gold and Why It Matters
Understanding the Value: How Much Is One Kilo of Gold and Why It Matters Gold has long been revered as a symbol of wealth, power, and stability. As an investment, it offers a hedge against inflation, currency fluctuations, and economic uncertainties. Among the various forms of gold investments, the kilo gold bar stands out for its substantial value and the allure it holds for serious investors. But how much is one kilo of gold worth, and why does it matter? Let’s delve into understanding the value of a kilo of gold and its significance in the world of precious metals investing.
By Lakhwinder Singh2 years ago in Education
Hottest in the Office
Dear Rafi, You’re very distracting to work around. For the first second I saw you the other day, I thought you were some type of executive. It took a moment to realize no, you were just the new guy, dressed up for the job he wants. Be still, my heart.
By Gabriel Shames4 days ago in Pride


Comments
There are no comments for this story
Be the first to respond and start the conversation.