
The motion of an airplane is represented by velocity-time graph as shown below. The distance covered by airplane in the first 30.5 second is ̱_______ km .
The motion of an airplane is represented by velocity-time graph as shown below. The distance covered by airplane in the first 30.5 second is _______ km . JEE Main 2025 (23rd Jan Shift 2) A. 9 B. 6 C. 3 D. 12
The motion of an airplane is represented by velocity-time graph as shown below. The distance covered by airplane in the first 30.5 second is _______ km . JEE Main 2025 (23rd Jan Shift 2)
A. 9
B. 6
C. 3
D. 12
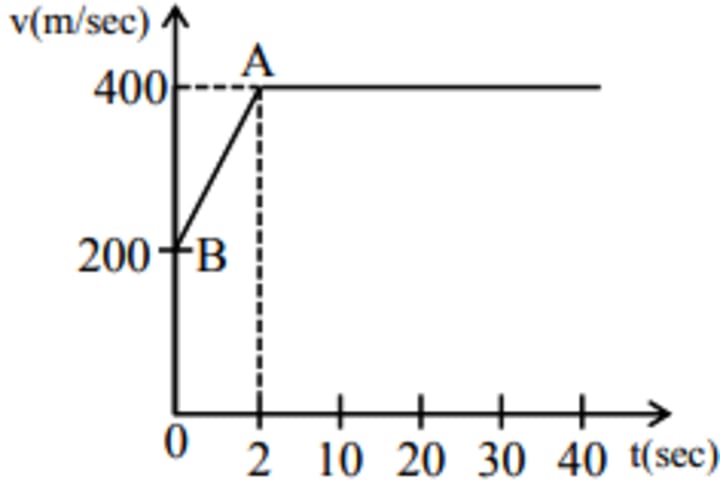
The Correct Option is D. 12 km
The motion of an airplane represented by a velocity-time graph involves concepts such as distance covered, velocity, time, and acceleration. Understanding the area under the velocity-time graph is essential to calculate the displacement or distance traveled. Key terms include uniform motion, variable motion, speed, time interval, initial velocity, final velocity, and average velocity. The graph may involve sections with constant speed or acceleration, making use of formulas from kinematics. Converting units from meters to kilometers or seconds to hours may also be required. Analyzing graphical data, interpreting slopes and areas, and applying geometric shapes like rectangles and triangles under the curve are vital. This topic connects to physics, motion graphs, graphical analysis, and distance-time relationships in real-world motion problems such as airplane travel.
Watch the video to understand how to calculate the distance covered by the airplane in the first 30.5 seconds using the area under the velocity-time graph.
Topics Covered:
Velocity-Time Graph
Concept of Uniform Acceleration
Distance calculation
Solution and Explanation:
To calculate the distance covered by the airplane in the first 30.5 seconds, we analyze its motion in two distinct phases:
1. Acceleration Phase (0–2 seconds):
The airplane accelerates uniformly from 200 m/s to 400 m/s. — Initial velocity (vi) = 200 m/s Final velocity (vf) = 400 m/s Time duration (t) = 2 s d1= [(vi +vf)/2] x t = (200+400)/2 x 2 = 600 m Distance covered
2. Constant Velocity Phase (2–30.5 seconds):
The airplane maintains a constant velocity of 400 m/s. — Velocity (v) = 400 m/s — Time duration (t) = 30.5–2 = 28.5 s
Distance covered: d2 = vx t = 400 × 28.5 = 11, 400 meters
Total Distance Calculation:
Total distance = d₁ + d2 = 600+11,400
Unit Conversion: 12, 000 meters = 12 km
Final Answer:
The airplane covers 12 kilometers in the first 30.5 seconds.
Students preparing for JEE Main, NEET, and CBSE Class 11/12 Physics. Don’t forget to Like, Share & Subscribe for more JEE questions!
FAQS (Frequently Asked Question)
Q1: What does the velocity-time graph of an airplane represent?
A1: A velocity-time graph shows how the velocity of the airplane changes over time. The slope of the graph can indicate acceleration, while the area under the graph gives the total distance traveled.
Q2: How do you calculate the distance from a velocity-time graph?
A2: The distance traveled is equal to the area under the velocity-time graph. For straight-line segments, this can be calculated using geometric formulas (e.g., area of a rectangle, triangle, or trapezoid).
Q3: What units are used for the distance in this question?
A3: The final answer is expected in kilometers (km). Make sure that all units are consistent, especially converting seconds to hours or meters to kilometers if needed.
Q4: What is the significance of "the first 30.5 seconds"?
A4: It means you need to calculate the area under the graph only up to the 30.5-second mark. This partial area gives the distance traveled in that specific time interval.
Q5: Can I use a formula to find the area under the curve if it's not a straight line?
A5: If the graph is curved or has a complex shape, you might need to use integration or approximate the area using geometric or numerical methods.
About the Creator
Redefining the Deal: How Modern Private Equity Is Building Sustainable Success
Private equity has long relied on proven playbooks, disciplined capital deployment, and patient timelines. For decades, these fundamentals delivered consistent returns and shaped a powerful asset class. However, markets no longer behave the way they once did. Economic cycles move faster, competition intensifies, and information flows instantly. As a result, private equity firms now face pressure to evolve while preserving the strengths that built their reputations. Modern success depends on adaptation, agility, and a sharper understanding of value creation.
By Michael Christopher Venturino5 days ago in Education
TUS NUA - ch 49
TUS NUA – ch 49 New Beginnings – Mia and Midnight (*)(*)(*) As Mia spoke on the phone to Ali’s sister, Ellen, Finola slipped quietly away and walked to the stream behind Tus Nua. Carefully, she put a block on her family so no one could know what she was about to do.
By Margaret Brennan4 days ago in Fiction


Comments
There are no comments for this story
Be the first to respond and start the conversation.