
Revealing Insights: Developing Hypotheses through Exploratory Data Analysis
A Hands-On Approach to Understanding Data Patterns and Informing Decisions


Understanding Exploratory Data Analysis (EDA)
Exploratory Data Analysis (EDA) is a critical step in the data science process. It involves summarising and visualising data to uncover patterns, trends, and anomalies. EDA is not just about collecting data; it's about asking questions, exploring relationships, and gaining insights that can guide further analysis and decision-making.
The Importance of EDA in Hypothesis Development
- Generating Hypotheses- EDA can stimulate your curiosity and lead to new questions and hypotheses. By visualising and understanding the data, you can identify potential relationships, trends, or outliers that might not be apparent from raw data alone.
- Validating Assumptions- EDA can help validate or invalidate existing assumptions about the data. For example, you might assume a normal distribution, but EDA could reveal a skewed distribution.
- Identifying Data Quality Issues- EDA can uncover errors, inconsistencies, or missing values in the data. Addressing these issues early on can prevent errors in subsequent analysis.
- Providing Context- EDA can provide context for your analysis. Understanding the distribution of variables, their relationships, and any outliers can help you interpret your results more meaningfully.
Key Techniques for EDA
Summary Statistics:
- Central Tendency: Mean, median, and mode provide information about the typical values in the data.
- Dispersion: Standard deviation, variance, and range measure the spread of the data.
- Distribution: Skewness and kurtosis indicate the shape of the distribution.
Visualisation:
- Histograms: Show the distribution of a single numerical variable.
- Box Plots: Visualise the distribution of a numerical variable, including quartiles, median, and outliers.
- Scatter Plots: Display the relationship between two numerical variables.
- Line Plots: Show trends over time or another numerical variable.
- Bar Charts: Compare categorical variables.
- Heatmaps: Visualize relationships between many variables.
Correlation Analysis:
- Pearson Correlation: Measures the linear relationship between two numerical variables.
- Spearman Correlation: Measures the monotonic relationship between two variables, regardless of linearity.
Example: Analyzing Customer Churn
Let's say you're working for a telecommunications company and want to understand why customers are churning. Through EDA, you might:
- Calculate summary statistics for variables like tenure, monthly bill, and total charges.
- Visualize the distribution of these variables using histograms and box plots.
- Examine the relationship between tenure and churn using a scatter plot.
- Calculate correlation coefficients between churn and other variables.
Based on these findings, you might hypothesize that customers with shorter tenure, higher monthly bills, or lower total charges are more likely to churn. These hypotheses can then be tested using more advanced statistical methods. Understanding these principles is often a key focus in a data analytics certification course in Delhi, Noida, Mumbai and other parts of India.
Tips for Effective EDA
- Start with simple visualizations and gradually add complexity as needed.
- Use appropriate visualizations for different types of data.
- Consider the context of the data when interpreting results.
- Be open-minded and explore different avenues of analysis.
- Document your findings to share with others.
Diving Deeper: Advanced EDA Techniques
While the basic EDA techniques discussed earlier provide a solid foundation, there are more advanced methods that can offer even greater insights:
1. Dimensionality Reduction:
Principal Component Analysis (PCA): Reduces the dimensionality of data while preserving the most important information. This can be useful for visualizing high-dimensional data or identifying patterns that might be obscured by the number of variables.
t-SNE: A non-linear dimensionality reduction technique that preserves local structure. It's often used for visualizing high-dimensional data in a low-dimensional space.
2. Clustering:
K-means Clustering: Divides data into k clusters based on similarity. This can be used to identify groups of similar observations within the data.
Hierarchical Clustering: Creates a hierarchy of clusters, starting from individual observations and merging them into larger clusters.
3. Anomaly Detection:
Statistical Methods: Identify outliers based on statistical measures like standard deviation or z-scores.
Machine Learning Techniques: Use algorithms like isolation forests or one-class support vector machines to detect anomalies.
4. Time Series Analysis:
Decomposition: Breaks down time series data into trend, seasonality, and residual components.
Forecasting: Uses statistical models or machine learning algorithms to predict future values of a time series.
5. Interactive Visualization:
Dashboards: Create interactive visualizations that allow users to explore data and uncover patterns.
Shiny Apps: Develop web applications that provide interactive interfaces for data exploration and analysis.
6. Automated EDA Tools:
AutoEDA: Leverage automated tools to perform common EDA tasks, such as summary statistics, visualizations, and correlation analysis.
Example: Customer Segmentation
Building on the previous example of customer churn, you could use clustering techniques to segment customers into different groups based on their characteristics. This might reveal that certain segments are more likely to churn due to factors like pricing, service quality, or customer support.
Key Considerations for Advanced EDA
- Computational Resources: Some advanced techniques, such as clustering and dimensionality reduction, can be computationally intensive, especially for large datasets.
- Domain Knowledge: Understanding the underlying domain can help you interpret results and identify meaningful patterns.
- Ethical Considerations: Ensure that your EDA practices are ethical and avoid biases in the data or analysis.
Conclusion
Exploratory Data Analysis is a powerful tool for uncovering insights and developing hypotheses. By effectively using EDA techniques, you can gain a deeper understanding of your data and make more informed decisions. Remember, EDA is not just a step in the data science process; it's an ongoing exploration that can lead to new discoveries and innovations.
About the Creator
Sanjeet Singh
As a Digital Marketing professional, I specialize in both technical and non-technical writing. My insatiable passion for learning drives me to explore diverse fields such as lifestyle, education, and technology.
Keep reading
More stories from Sanjeet Singh and writers in Education and other communities.
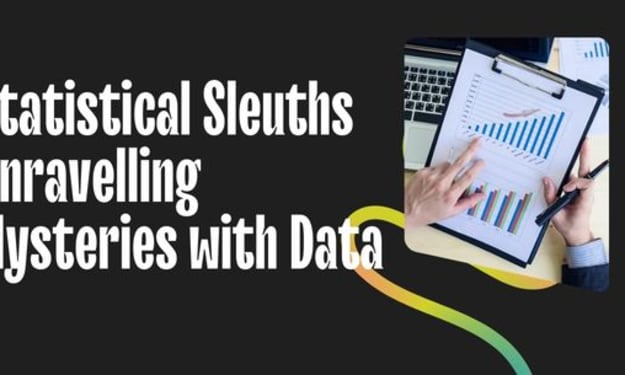
Statistical Sleuths: Unravelling Mysteries with Data
In the vast ocean of information that surrounds us, data is the hidden treasure waiting to be discovered. Statistical sleuths are the modern-day detectives who use their analytical skills to extract valuable insights from this treasure trove. They employ a variety of statistical techniques to uncover patterns, trends, and relationships that would otherwise remain obscured.
By Sanjeet Singhabout a year ago in Education
Graduated… But Still Broke. Why
Graduation day feels like victory. The hall is full. Names are called one by one. Parents sit proudly in the audience, holding their phones high to record the moment. Friends clap loudly. Teachers smile with approval. For years, this was the goal. Study hard. Get good grades. Earn the degree. And when that certificate finally rests in your hands, it feels like a passport to success. But sometimes, the applause is louder than the opportunity that follows.
By Shahid Zaman3 days ago in Education
The Dark Side of AI: What Could Artificial Intelligence Become in 100 Years?
But while AI promises innovation and efficiency, an important question remains: What could AI become 100 years from now?Looking ahead to the next century, the darker possibilities of artificial intelligence deserve serious attention.
By Spondan Chowdhury4 days ago in Education


Comments
There are no comments for this story
Be the first to respond and start the conversation.